Step Line Series
The StepLineSeries is similar to the Line Series. The difference is that the StepLineSeries connects its points through a horizontal and vertical line instead of a straight line. The RisersPosition property defines the end of the first and the beginning of the second line.
Properties
StepLineSeries class inherits from the LineSeries class - See the inherited properties.
-
RisersPosition: Gets or sets the RisersPosition that will be used to draw the series.
- Default: Risers' position depends on the axis' plot mode.
- OnTicks: Risers will be positioned where the ticks of the axis are positioned.
- BetweenTicks: Risers will be positioned between the ticks of the axis.
Example
Example 1 shows how to create a RadCartesianChart with a StepLineSeries.
Example 1: Defining a RadCartesianChart with a StepLineSeries
<Grid xmlns:telerikChart="using:Telerik.UI.Xaml.Controls.Chart"
xmlns:telerikCharting="using:Telerik.Charting">
<telerikChart:RadCartesianChart>
<telerikChart:RadCartesianChart.HorizontalAxis>
<telerikChart:CategoricalAxis/>
</telerikChart:RadCartesianChart.HorizontalAxis>
<telerikChart:RadCartesianChart.VerticalAxis>
<telerikChart:LinearAxis/>
</telerikChart:RadCartesianChart.VerticalAxis>
<telerikChart:StepLineSeries>
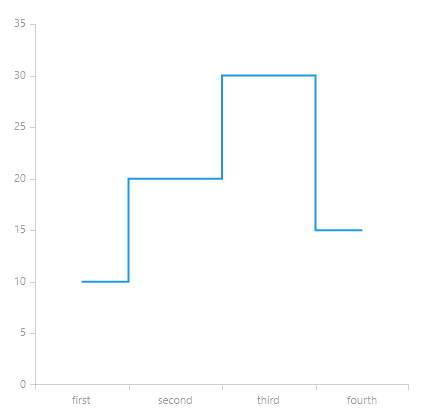
<telerikCharting:CategoricalDataPoint Category="first" Value="10"/>
<telerikCharting:CategoricalDataPoint Category="second" Value="20"/>
<telerikCharting:CategoricalDataPoint Category="third" Value="30"/>
<telerikCharting:CategoricalDataPoint Category="fourth" Value="15"/>
</telerikChart:StepLineSeries>
</telerikChart:RadCartesianChart>
</Grid>
Figure 1: Result from Example 1