.NET MAUI Pie Chart
The Pie Chart visualizes its data points by using the radial coordinate system. Each data point is represented as a slice from a pie. The ratio between the space consumed by each slice and the space consumed by the whole chart is the same as the ratio between the value of the data point that it represents and the total value of all data points in the series.
Properties
The Pie Chart supports the following properties:
-
Series—Gets a collection of all series presented by the chart instance. -
Behaviors—Gets a collection of all enabled behaviors. -
Palette—Gets or sets theChartPaletteinstance that defines the appearance of the chart. -
PaletteName—Gets or sets the name of the predefinedPalettethat will be applied to the chart. -
SelectionPalette—Gets or sets theChartPaletteinstance that defines the appearance of the chart for the selected series and/or data points. -
SelectionPaletteName—Gets or sets the name of the predefinedSelectionPalettethat will be applied to the chart.
Series
The PieChart supports the Pie Series, which visualize a single series of data in a pie chart. The sweep of a pie slice is directly proportional to the magnitude of the data point values.
Customize the Chart Colors
You can take advantage of the available customization options the Chart control provides. You can change the default Chart and series colors by setting a Palette. For more details on the suggested implementation, see the Creating Custom PieChart Palettes KB article.
PieChart Example
The following example shows the full definition of the chart.
1. Create the needed business object, for example:
public class CategoricalData
{
    public object Category { get; set; }
    public double Value { get; set; }
}
2. Create a ViewModel:
public class ViewModel
{
    public ObservableCollection<CategoricalData> Data { get; set; }

    public ViewModel()
    {
        this.Data = GetCategoricalData();
    }

    private static ObservableCollection<CategoricalData> GetCategoricalData()
    {
        var data = new ObservableCollection<CategoricalData>
        {
            new CategoricalData { Category = "Greenings", Value = 52 },
            new CategoricalData { Category = "Perfecto", Value = 19 },
            new CategoricalData { Category = "NearBy", Value = 82 },
            new CategoricalData { Category = "Family", Value = 23 },
            new CategoricalData { Category = "Fresh", Value = 56 },
        };
        return data;
    }
}
3. Declare a RadPieChart with a Pie Series in XAML:
<telerik:RadPieChart>
    <telerik:RadPieChart.BindingContext>
        <local:ViewModel />
    </telerik:RadPieChart.BindingContext>
    <telerik:RadPieChart.Series>
        <telerik:PieSeries ShowLabels="True"
                           RadiusFactor="0.8"
                           ValueBinding="Value"
                           ItemsSource="{Binding Data}" />
    </telerik:RadPieChart.Series>
</telerik:RadPieChart>
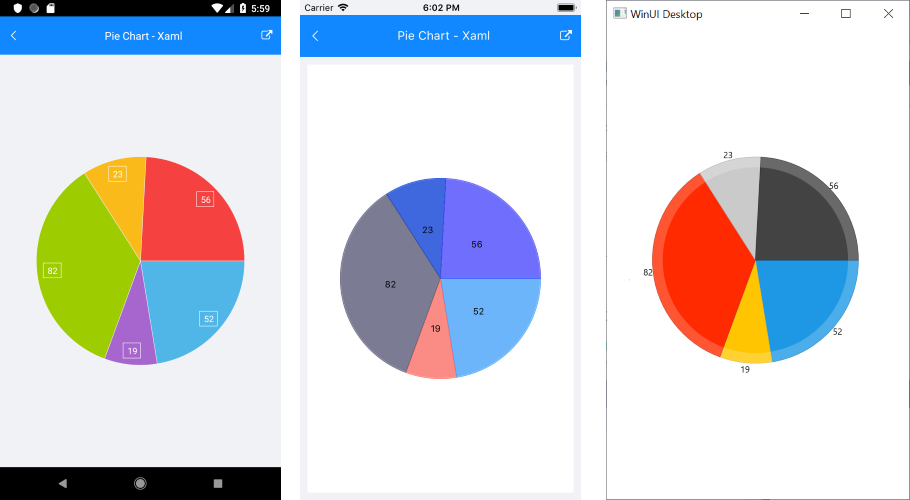
The following image shows the end result: