.NET MAUI Chart Spline Series
The Cartesian Chart visualizes each data item from the Line Series and connects them with curved line segments. The Spline Series extend the Line Series, so they are also Categorical Series and require one Categorical Axis and one Numerical Axis.
Features
The Spline Series extend the Line Series so they provide the same properties to change their style:
-
Stroke(Color)—Changes the color for drawing lines. -
StrokeThickness(double)—Changes the width of the lines.
Spline Series Example
The following example shows how to create a RadCartesianChart with a Spline Series:
1. Create the needed business objects, for example:
public class CategoricalData
{
    public object Category { get; set; }
    public double Value { get; set; }
}
2. Create a ViewModel:
public class CategoricalDataViewModel
{
    public ObservableCollection<CategoricalData> Data { get; set; }

    public CategoricalDataViewModel()
    {
        this.Data = GetCategoricalData();
    }

    private static ObservableCollection<CategoricalData> GetCategoricalData()
    {
        var data = new ObservableCollection<CategoricalData>
        {
            new CategoricalData { Category = "A", Value = 101 },
            new CategoricalData { Category = "B", Value = 45 },
            new CategoricalData { Category = "C", Value = 77 },
            new CategoricalData { Category = "D", Value = 15 },
            new CategoricalData { Category = "E", Value = 56 },
        };
        return data;
    }
}
3. Use the following snippet to declare a RadCartesianChart with a Spline Series in XAML:
<telerik:RadCartesianChart>
    <telerik:RadCartesianChart.BindingContext>
        <local:CategoricalDataViewModel />
    </telerik:RadCartesianChart.BindingContext>
    <telerik:RadCartesianChart.HorizontalAxis>
        <telerik:CategoricalAxis LabelFitMode="MultiLine"
                              PlotMode="OnTicks" />
    </telerik:RadCartesianChart.HorizontalAxis>
    <telerik:RadCartesianChart.VerticalAxis>
        <telerik:NumericalAxis />
    </telerik:RadCartesianChart.VerticalAxis>
    <telerik:RadCartesianChart.Series>
        <telerik:SplineSeries ValueBinding="Value"
                           CategoryBinding="Category"
                           ItemsSource="{Binding Data}" />
    </telerik:RadCartesianChart.Series>
</telerik:RadCartesianChart>
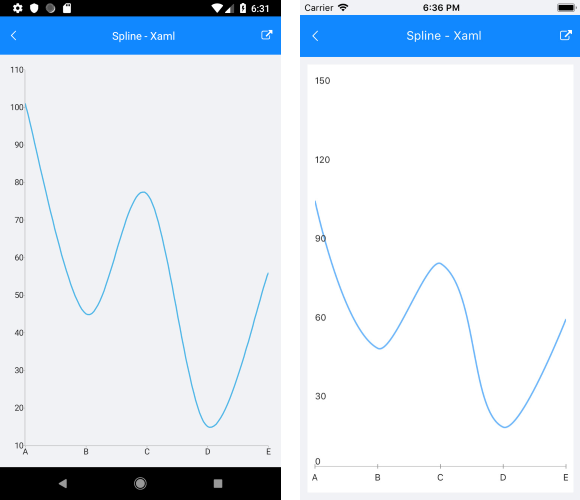
The following image shows the end result:
Customization Example
You can further customize the Spline Series:
var series = new SplineSeries
{
    Stroke = new Color(0.6, 0.6, 0.9),
    StrokeThickness = 5
};