Chart Data
The chart needs to have a source for its data, for the categories and values of the series and for its title. The chart data is represented by objects inheriting from the IChartData interface. There can be three types of data Numeric, String and Formula. The different types are represented by the ChartDataType enum. The Numeric and String types contain a collection of, respectively, doubles and Strings, while the Formula type contains a string which represents a formula, whose result is the data itself.
The FormulaChartData type is abstract and it is implemented by the WorkbookFormulaChartData class. This class combines the formula with its actual data source, that is the Worksheet object. It contains the following public constructors, properties and methods, other than the Formula property, inherited from FormulaChartData:
WorkbookFormulaChartData(Worksheet worksheet, params CellRange[] ranges)
WorkbookFormulaChartData(Workbook workbook, string formula)
IEnumerable<CellRange> EnumerateCellRanges(out Worksheet worksheet): Enumerates the cell ranges that contain the actual chart data.
bool TryEnumerateCellRanges(out IEnumerable
resultCellRanges, out Worksheet worksheet): Enumerates the cell ranges that contain the actual chart data. Returns a value indicating whether the enumeration was successful. IChartData Clone(): Creates a deep copy of the object.
Workbook Workbook: Gets the workbook that the formula refers to get the chart data.
Example 1: Using IChartData
FloatingChartShape chartShape = new FloatingChartShape(worksheet, new CellIndex(1, 1), new CellRange(1, 1, 1, 1), ChartType.Column)
{
Width = 460,
Height = 250
};
DocumentChart chart = new DocumentChart();
BarSeriesGroup barSeriesGroup = new BarSeriesGroup();
barSeriesGroup.BarDirection = BarDirection.Column;
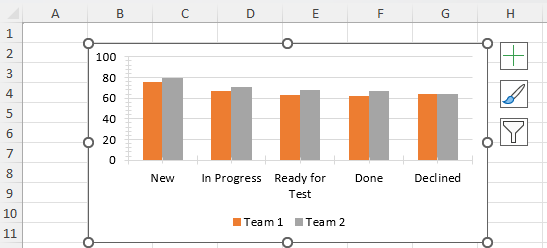
StringChartData barCategoryData = new StringChartData(new List<string> { "New", "In Progress", "Ready for Test", "Done", "Declined" });
NumericChartData barValueScore1Data = new NumericChartData(new List<double> { 75.31, 66.3, 62.78, 61.72, 63.9 });
NumericChartData barValueScore2Data = new NumericChartData(new List<double> { 78.56, 70.7, 67.63, 66.71, 63.9 });
barSeriesGroup.Series.Add(barCategoryData, barValueScore1Data);
barSeriesGroup.Series.Add(barCategoryData, barValueScore2Data);
chart.SeriesGroups.Add(barSeriesGroup);
ValueAxis valueAxis = new ValueAxis();
valueAxis.Outline.Fill = new SolidFill(new ThemableColor(ThemeColorType.Text1, 0.85));
valueAxis.Outline.Width = 0.75;
CategoryAxis categoryAxis = new CategoryAxis();
categoryAxis.Outline.Fill = new SolidFill(new ThemableColor(ThemeColorType.Text1, 0.85));
categoryAxis.Outline.Width = 0.75;
chart.PrimaryAxes = new AxisGroup(categoryAxis, valueAxis);
worksheet.Charts.Add(chartShape);
worksheet.Charts[0].Chart.SeriesGroups.First().Series.First().Title = new TextTitle("Team 1");
worksheet.Charts[0].Chart.SeriesGroups.First().Series.Last().Title = new TextTitle("Team 2");
chartShape.Chart = chart;
Using Chart Data in RadSpreadProcessing