Chart for Xamarin.iOS: Financial Indicators Series
This article provides a brief description and a list of the important properties of each indicator supported by TKChart. The indicators are divided in two groups - Technical Overlays and Technical Indicators. To set up a financial indicator, you have to initialize it with TKChartCandlestickSeries or TKChartOhlcSeries containing financial data.
Technical Overlays
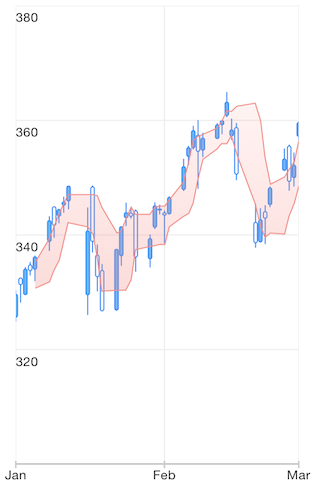
Here is an example how to create a Bollinger Band indicator:
var candlesticks = new TKChartCandlestickSeries (financialDataPoints.ToArray ());
var bollingerBands = new TKChartBollingerBandIndicator (candlesticks);
financialChart.AddSeries (candlesticks);
financialChart.AddSeries (bollingerBands);
And here are the rest of the available Technical Overlays
- Simple Moving Average (SMA) - A simple moving average (SMA) is the unweighted mean of the previous n data. To use this indicator you should instantiate
TKChartSimpleMovingAverageIndicatorand change itsPeriodproperty if needed. - Exponential Moving Average (EMA) - A type of moving average that is similar to a simple moving average, except that more weight is given to the latest data. Use
TKChartExponentialMovingAverageIndicatorclass. - Weighted Moving Average - Weighted averages assign a heavier weighting to more current data points. Use
TKChartWeightedMovingAverageIndicatorclass. - Triangular Moving Average - The Triangular Moving Average is a double-smoothed Simple Moving Average that gives more weight to the middle section of the data interval. Use
TKChartTriangularMovingAverageIndicatorclass. - Modified Moving Average - Modified moving averages are similar to simple moving averages. The first point of the modified moving average is calculated the same way the first point of the simple moving average is calculated. However, all subsequent points are calculated by first adding the new price and then subtracting the last average from the resulting sum. The difference is the new point, or modified moving average. Use
TKChartModifiedMovingAverageIndicatorclass. - Adaptive Moving Average - uses three parameters to calculate its value: Period, SlowPeriod and FastPeriod. Use
TKChartAdaptiveMovingAverageIndicatorclass. - Bollinger Bands - volatility bands placed above and below a moving average. Use
TKChartBollingerBandIndicatorclass. - Moving Average Envelopes - percentage-based envelopes set above and below a moving average. Use
TKChartMovingAverageEnvelopesIndicatorclass. - Typical Price - the arithmetic average of the high, low, and closing prices for a given period. Use
TKChartTypicalPriceIndicatorclass. - Weighted Close - similar to Typical Price - the difference is that the weighted close place greater weighting on closing price. Use
TKChartWeightedCloseIndicatorclass. - Median Price - the midpoint of each day's price. Use
TKChartMedianPriceIndicatorclass.
Technical Indicators
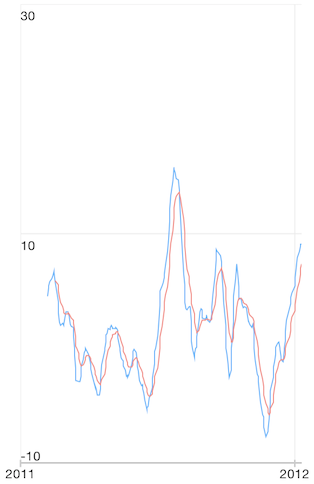
Here is an example how to set up Moving Average Convergence Divergence indicator:
var candlesticks = new TKChartCandlestickSeries (financialDataPoints.ToArray());
var macdIndicator = new TKChartMACDIndicator (candlesticks);
macdIndicator.LongPeriod = 26;
macdIndicator.ShortPeriod = 12;
macdIndicator.SignalPeriod = 9;
financialChart.AddSeries (macdIndicator);
And here are the rest of the available Technical Indicators
- Moving Average Convergence Divergence - A trend-following momentum indicator that shows the relationship between two moving averages of prices. Use
TKChartMACDIndicatorclass. - Percentage Price Oscillator - a momentum oscillator that measures the difference between two moving averages as a percentage of the larger moving average. Use
TKChartPercentagePriceOscillatorclass. - Percentage Volume Oscillator - a momentum oscillator for volume. PVO measures the difference between two volume-based moving averages as a percentage of the larger moving average. Use
TKChartPercentageVolumeOscillatorclass. - Absolute Volume Oscillator - computes the difference between two average volume measures. Use
TKChartAbsoluteVolumeOscillator. - Relative Strength Index - intended to chart the current and historical strength or weakness of a stock or market based on the closing prices of a recent trading period. Use
TKChartRelativeStrengthIndexclass. - Relative Momentum Index - the aim of this indicator is to improve the data provided by the classical RSI indicator if the price reaches oversold/overbought areas. Use
TKChartRelativeMomentumIndexclass. - Accumulation Distribution Line - a volume-based indicator designed to measure the cumulative flow of money into and out of a security. Use
TKChartAccumulationDistributionLineclass. - True Range - measures the daily range plus any gap from the closing price of the preceding day. Use
TKChartTrueRangeIndicatorclass. - Average True Range - an indicator that measures volatility. Use
TKChartAverageTrueRangeIndicatorclass. - Commodity Channel Index - measures a security’s variation from the statistical mean. Use
TKChartCommodityChannelIndexclass. - Fast Stochastic Indicator - Stochastic Oscillator is a momentum indicator that shows the location of the close relative to the high - low range over a set number of periods. Use
TKChartFastStochasticIndicatorclass. - Slow Stochastic Indicator - The Slow Stochastic Oscillator smooths %K with a 3-day SMA, which is exactly what %D is in the Fast Stochastic Oscillator. Use
TKChartSlowStochasticIndicatorclass. - Full Stochastic Indicators - a fully customizable version of the Slow Stochastic Oscillator. Use
TKChartFullStochasticIndicatorclass. - Rate Of Change - a pure momentum oscillator that measures the percent change in price from one period to the next. Use
TKChartRateOfChangeIndicatorclass. - TRIX - a momentum oscillator that displays the percent rate of change of a triple exponentially smoothed moving average. Use
TKChartTRIXIndicatorclass. - Williams %R Indicator - a momentum indicator that is the inverse of the Fast Stochastic Oscillator. Use
TKChartWilliamsPercentIndicatorclass. - Ease Of Movement - a volume-based oscillator that fluctuates above and below the zero line. Use
TKChartEaseOfMovementIndicatorclass. - Detrended Price Oscillator - an indicator designed to remove trend from price and make it easier to identify cycles. Use
TKChartDetrendedPriceOscillatorclass. - Force Index - an indicator used to illustrate how strong the actual buying or selling pressure is. Use
TKChartForceIndexIndicatorclass. - Rapid Adaptive Variance Indicator - measures trend intensity instead of trend direction. Use
TKChartRapidAdaptiveVarianceIndicatorclass. - Standard Deviation - a statistical term that measures the amount of variability or dispersion around an average. Use
TKChartStandardDeviationIndicatorclass. - On Balance Volume - measures buying and selling pressure as a cumulative indicator that adds volume on up days and subtracts volume on down days. Use
TKChartOnBalanceVolumeIndicatorclass. - Price Volume Trend - technical indicator consisting of a cumulative volume line that adds or subtracts a multiple of the percentage change in share price trend and current volume, depending upon their upward or downward movements. Use
TKChartPriceVolumeTrendIndicatorclass. - Positive Volume Index - an indicator that is based on days where trading volume has significantly increased from the previous day. Use
TKChartPositiveVolumeIndexIndicatorclass. - Negative Volume Index - a cumulative indicator that uses the change in volume to decide when the smart money is active. Use
TKChartNegativeVolumeIndexIndicatorclass. - Money Flow Index - an oscillator that uses both price and volume to measure buying and selling pressure. Use
TKChartMoneyFlowIndexIndicatorclass. - Ultimate Oscillator - a technical indicator that uses the weighted average of three different time periods to reduce the volatility and false transaction signals that are associated with many other indicators that mainly rely on a single time period. Use
TKChartUltimateOscillatorclass. - Market Facilitation Index - designed for evaluation the willingness of the market to move the price. Use
TKChartMarketFacilitationIndexclass. - Chaikin Oscillator - an oscillator which measures the accumulation distribution line of the MACD. Use
TKChartChaikinOscillatorclass.