PlotBand Annotation Types
In this article the properties of the PlotBandAnnotations are described depending on the type of axis the annotation is associated with - cartesian, polar or radial.
PlotBand Annotation Properties
The common properties for all PlotBandAnnotations are:
- Fill: Gets or sets the Brush that specifies how the shape's interior is painted.
- StrokeDashArray: Gets or sets a collection of double values that indicates the pattern of dashes and gaps that is used to outline stroked annotation.
- Stroke: Gets or sets the Brush that specifies how the shape outline is painted.
- StrokeThickness: Gets or sets the width of the shape stroke outline.
CartesianPlotBandAnnotation Specific Properties
- Axis: The cartesian plotband annotation needs to be associated with the horizontal or vertical axis explicitly.
-
From (of type object): The starting value for the plotband.
When the axis is numerical (Linear or Logarithmic) a numeric value is expected, and when it is a CategoricalAxis - a category is expected.
-
To (of type object): The ending value for the plotband.
When the axis is numerical (Linear or Logarithmic) a numeric value is expected, and when it is a CategoricalAxis - a category is expected.
Label (string): The string that defines the label of the annotation. By default it is null.
- LabelDefinition (ChartAnnotationLabelDefinition): Defines the position of the annotation label. Check the Annotation Labels topic for more details.
PolarAxisPlotBandAnnotation Specific Properties
- From (of type double): The starting point for the plotband.
- To (of type double): The ending point for the plotband.
RadialAxisPlotBandAnnotation Specific Properties
-
From (of type object): The starting point for the plotband.
When the radial axis is a NumericalRadialAxis a numeric value is expected, and when it is a CategoricalRadialAxis - a category.
-
To (of type object): the ending point for the plotband.
When the radial axis is a NumericalRadialAxis a numeric value is expected, and when it is a CategoricalRadialAxis - a category.
Example of CartesianPlotBandAnnotations
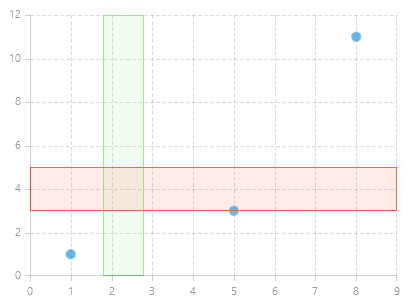
CartesianPlotbandAnnotation can be either a horizontal or a vertical stripe that crosses the whole chart and marks a value range on the associate axis. Example 1 demonstrates how to define both a horizontal and vertical CartesianPlotBandAnnotation in a RadCartesianChart.
Example 1: CartesianPlotbandAnnotation
<Grid xmlns:telerikChart="using:Telerik.UI.Xaml.Controls.Chart"
    xmlns:telerikCharting="using:Telerik.Charting">
    <telerikChart:RadCartesianChart Width="400" Height="300">
        <telerikChart:RadCartesianChart.Annotations>
            <telerikChart:CartesianPlotBandAnnotation Axis="{Binding ElementName=horizontalAxis}"
                                                    From="1.8" To="2.8"
                                                    Stroke="LightGreen" StrokeThickness="1" Fill="#2090EE90"/>
            <telerikChart:CartesianPlotBandAnnotation Axis="{Binding ElementName=verticalAxis}"
                                                    From="3" To="5"
                                                    Stroke="Tomato" StrokeThickness="1" Fill="#20FF6347"/>
        </telerikChart:RadCartesianChart.Annotations>
        <telerikChart:RadCartesianChart.HorizontalAxis>
            <telerikChart:LinearAxis x:Name="horizontalAxis"/>
        </telerikChart:RadCartesianChart.HorizontalAxis>
        <telerikChart:RadCartesianChart.VerticalAxis>
            <telerikChart:LinearAxis x:Name="verticalAxis"/>
        </telerikChart:RadCartesianChart.VerticalAxis>
        <telerikChart:ScatterPointSeries>
            <telerikChart:ScatterPointSeries.DataPoints>
                <telerikCharting:ScatterDataPoint XValue="1" YValue="1" />
                <telerikCharting:ScatterDataPoint XValue="5" YValue="3" />
                <telerikCharting:ScatterDataPoint XValue="8" YValue="11" />
            </telerikChart:ScatterPointSeries.DataPoints>
        </telerikChart:ScatterPointSeries>
        <telerikChart:RadCartesianChart.Grid>
            <telerikChart:CartesianChartGrid MajorGridLinesVisibility="XY" />
        </telerikChart:RadCartesianChart.Grid>
    </telerikChart:RadCartesianChart>
</Grid>
Figure 1: RadCartesianChart with vertical and horizontal CartesianPlotBandAnnotations
Example of PolarAxisPlotBandAnnotation
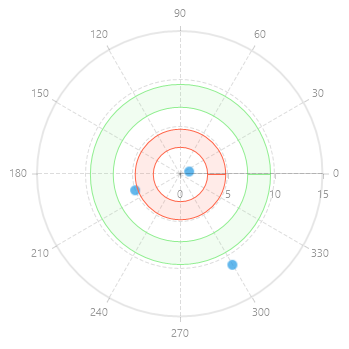
PolarAxisPlotBandAnnotation is represented by concentric stripe that mark a specific value (radius) range on the polar axis. Example 2 demonstrates how to define PolarAxisPlotBandAnnotation in a RadPolarChart.
Example 2: PolarAxisPlotBandAnnotation
<Grid xmlns:telerikChart="using:Telerik.UI.Xaml.Controls.Chart"
      xmlns:telerikCharting="using:Telerik.Charting">
    <telerikChart:RadPolarChart Height="350">
        <telerikChart:RadPolarChart.Annotations>
        <telerikChart:PolarAxisPlotBandAnnotation From="2.8" To="4.8" Stroke="Tomato" Fill="#20FF6347"/>
        <telerikChart:PolarAxisPlotBandAnnotation From="7" To="9.5" Stroke="LightGreen" Fill="#2090EE90"/>
    </telerikChart:RadPolarChart.Annotations>
    <telerikChart:RadPolarChart.RadialAxis>
        <telerikChart:NumericalRadialAxis/>
    </telerikChart:RadPolarChart.RadialAxis>
    <telerikChart:RadPolarChart.PolarAxis>
        <telerikChart:PolarAxis/>
    </telerikChart:RadPolarChart.PolarAxis>
    <telerikChart:PolarPointSeries>
        <telerikChart:PolarPointSeries.DataPoints>
            <telerikCharting:PolarDataPoint Value="1" Angle="15" />
            <telerikCharting:PolarDataPoint Value="5" Angle="200" />
            <telerikCharting:PolarDataPoint Value="11" Angle="300" />
        </telerikChart:PolarPointSeries.DataPoints>
    </telerikChart:PolarPointSeries>
        <telerikChart:RadPolarChart.Grid>
            <telerikChart:PolarChartGrid GridLineVisibility="Both" />
        </telerikChart:RadPolarChart.Grid>
    </telerikChart:RadPolarChart>
</Grid>
Figure 2: RadPolarChart with several PolarAxisPlotBandAnnotation
Example of RadialAxisPlotBandAnnotation
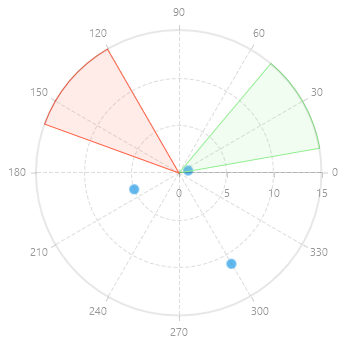
RadialAxisPlotBandAnnotation is represented by a sector of the circle (pie slice) that marks specific angular/categorical range. Example 3 demonstrates how to define a RadialAxisPlotBandAnnotation in a RadPolarChart.
Example 3: RadialAxisPlotBandAnnotation
<Grid xmlns:telerikChart="using:Telerik.UI.Xaml.Controls.Chart"
      xmlns:telerikCharting="using:Telerik.Charting">
    <telerikChart:RadPolarChart Height="350">
        <telerikChart:RadPolarChart.Annotations>
            <telerikChart:RadialAxisPlotBandAnnotation From="10" To="50"  Stroke="LightGreen" StrokeThickness="1" Fill="#2090EE90"/>
            <telerikChart:RadialAxisPlotBandAnnotation From="120" To="160"  Stroke="Tomato" StrokeThickness="1" Fill="#20FF6347"/>
        </telerikChart:RadPolarChart.Annotations>
        <telerikChart:RadPolarChart.RadialAxis>
            <telerikChart:NumericalRadialAxis/>
        </telerikChart:RadPolarChart.RadialAxis>
        <telerikChart:RadPolarChart.PolarAxis>
            <telerikChart:PolarAxis/>
        </telerikChart:RadPolarChart.PolarAxis>
        <telerikChart:PolarPointSeries>
            <telerikChart:PolarPointSeries.DataPoints>
                <telerikCharting:PolarDataPoint Value="1" Angle="15" />
                <telerikCharting:PolarDataPoint Value="5" Angle="200" />
                <telerikCharting:PolarDataPoint Value="11" Angle="300" />
            </telerikChart:PolarPointSeries.DataPoints>
        </telerikChart:PolarPointSeries>
        <telerikChart:RadPolarChart.Grid>
            <telerikChart:PolarChartGrid GridLineVisibility="Both" />
        </telerikChart:RadPolarChart.Grid>
    </telerikChart:RadPolarChart>
</Grid>
Figure 3: RadPolarChart with several RadialAxisPlotBandAnnotations