Annotation Labels
Annotation labels are supported out-of-the-box only for the annotation classes that inherit from the CartesianStrokedAnnotation base class.
The CartesianChartAnnotation base class provides a Label property to specify the label string and a LabelDefinition to control its properties like Format, LabelTemplate and positioning. Annotations provide a mechanism for label positioning that consists of three layers - primary (Location), secondary (HorizontalAlignment/VerticalAlignment), and tertiary (HorizontalOffset/VerticalOffset).
ChartAnnotationLabelDefinition Positioning Properties
-
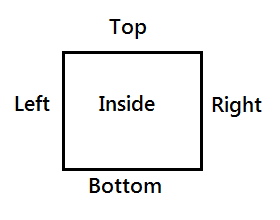
Location: This is the highest priority property that defines the position of the label relative to the annotation. Figure 1 shows the possible values.
Figure 1: Annotation Labels Location
-
HorizontalAlignment Defines the horizontal alignment value that can be used as a secondary mechanism in conjunction with the primary Location property value.
The HorizontalAlignment property value is not applicable, if the Location property is set to either ChartAnnotationLabelLocation.Left, or ChartAnnotationLabelLocation.Right.
-
VerticalAlignment: Defines the vertical alignment value that can be used in conjunction with the primary Location property value.
The VerticalAlignment property value is not applicable, if the Location property is set to either ChartAnnotationLabelLocation.Top, or ChartAnnotationLabelLocation.Bottom.
-
HorizontalOffset: Defines the horizontal offset in pixels that will be applied to the annotation horizontal position after primary Location and the secondary HorizontalAlignment properties are applied.
The HorizontalOffset property value is not applicable, if the HorizontalAlignment property is set to Stretch.
-
VerticalOffset: Defines the vertical offset in pixels that will be applied to the annotation vertical position after primary Location and the secondary VerticalAlignment properties are applied.
The VerticalOffset property value is not applicable, if the VerticalAlignment property is set to Stretch.
Label Configuration Example
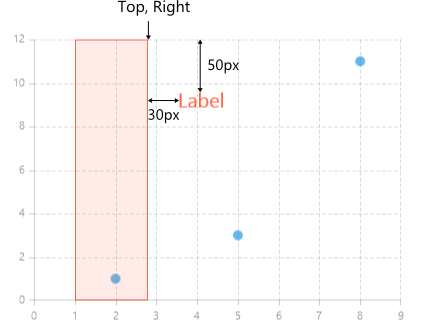
Example 1 demonstrates how to configure the position of the Label for a CartesianPlotBandAnnotation.
Example 1: Positioning CartesianPlotBandAnnotation Label
<Grid xmlns:telerikChart="using:Telerik.UI.Xaml.Controls.Chart"
      xmlns:telerikCharting="using:Telerik.Charting">
    <telerikChart:RadCartesianChart Width="400" Height="300">
        <telerikChart:RadCartesianChart.Annotations>
            <telerikChart:CartesianPlotBandAnnotation Axis="{Binding ElementName=hAxis}" From="1" To="2.8"
                                                  Stroke="Tomato" StrokeThickness="1" Fill="#20FF6347"
                                                  Label="Label" Foreground="Tomato" FontSize="20">
                <telerikChart:CartesianPlotBandAnnotation.LabelDefinition>
                    <telerikChart:ChartAnnotationLabelDefinition Location="Right" VerticalAlignment="Top"
                                                             VerticalOffset="50" HorizontalOffset="30" />
                </telerikChart:CartesianPlotBandAnnotation.LabelDefinition>
            </telerikChart:CartesianPlotBandAnnotation>
        </telerikChart:RadCartesianChart.Annotations>

        <telerikChart:RadCartesianChart.HorizontalAxis>
            <telerikChart:LinearAxis x:Name="hAxis"/>
        </telerikChart:RadCartesianChart.HorizontalAxis>
        <telerikChart:RadCartesianChart.VerticalAxis>
            <telerikChart:LinearAxis/>
        </telerikChart:RadCartesianChart.VerticalAxis>
        <telerikChart:ScatterPointSeries>
            <telerikChart:ScatterPointSeries.DataPoints>
                <telerikCharting:ScatterDataPoint XValue="2" YValue="1" />
                <telerikCharting:ScatterDataPoint XValue="5" YValue="3" />
                <telerikCharting:ScatterDataPoint XValue="8" YValue="11" />
            </telerikChart:ScatterPointSeries.DataPoints>
        </telerikChart:ScatterPointSeries>
        <telerikChart:RadCartesianChart.Grid>
            <telerikChart:CartesianChartGrid MajorGridLinesVisibility="XY" />
        </telerikChart:RadCartesianChart.Grid>
    </telerikChart:RadCartesianChart>
</Grid>
Figure 1: CartesianPlotBandAnnotation with a positioned label