GridLine Annotation Types
This article describes the properties of the GridLineAnnotations depending on the type of axis the annotation is associated with - cartesian, polar or radial.
GridLine Annotation Properties
The common properties for all GridLineAnnotations are:
- StrokeDashArray (DoubleCollection): Gets or sets a collection of double values that indicates the pattern of dashes and gaps that is used to outline the stroked annotation.
- Stroke (Brush): Gets or sets the Brush that specifies how the shape outline is painted.
- StrokeThickness (double): Gets or sets the width of the shape stroke outline.
CartesianGridLineAnnotation Specific Properties
- Axis (CartesianAxis): The CartesianGridLineAnnotation needs to be associated with horizontal or vertical cartesian axis explicitly.
-
Value (object): The place on the associated axis where a line crosses it.
When the associated axis is numerical (Linear or Logarithmic) a numeric value is expected, and when it is a CategoricalAxis - a category is expected.
Label (string): The string that defines the label of the annotation. By default it is null.
- LabelDefinition (ChartAnnotationLabelDefinition): Defines the position of the annotation label. Check the Annotation Labels topic for more details.
PolarAxisGridLineAnnotation Specific Properties
- Value (double): Specifies the location on the polar axis (the radius), where the circular grid line crosses it.
RadialAxisGridLineAnnotation Specific Properties
- Value (object): Specifies the location (angle or category) on the radial axis, where the grid line is drawn.
When the radial axis is NumericalRadialAxis a numeric value is expected, and when it is a CategoricalRadialAxis - a category is expected.
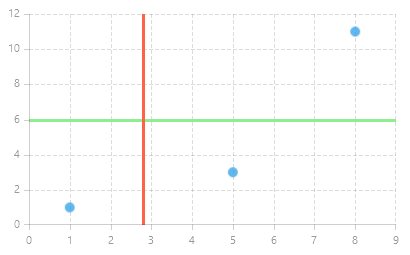
Example of CartesianGridLineAnnotation
In the case of the RadCartesianChart, the GridLine represents a vertical or horizontal line that crosses the entire plot area. Example 1 demonstrates how to define both a horizontal and a vertical CartesianGridLineAnnotation in a RadCartesianChart.
Example 1: CartesianGridLineAnnotation
<Grid xmlns:telerikChart="using:Telerik.UI.Xaml.Controls.Chart"
      xmlns:telerikCharting="using:Telerik.Charting">
    <telerikChart:RadCartesianChart x:Name="cartesianChart" Width="400" Height="250">
        <telerikChart:RadCartesianChart.Annotations>
            <telerikChart:CartesianGridLineAnnotation
                Axis="{Binding ElementName=cartesianChart, Path=VerticalAxis}"
                Value="6" Stroke="LightGreen" StrokeThickness="3"/>
            <telerikChart:CartesianGridLineAnnotation
                Axis="{Binding ElementName=cartesianChart, Path=HorizontalAxis}"
                Value="2.8" Stroke="Tomato" StrokeThickness="3"/>
        </telerikChart:RadCartesianChart.Annotations>

        <telerikChart:RadCartesianChart.HorizontalAxis>
            <telerikChart:LinearAxis />
        </telerikChart:RadCartesianChart.HorizontalAxis>
        <telerikChart:RadCartesianChart.VerticalAxis>
            <telerikChart:LinearAxis/>
        </telerikChart:RadCartesianChart.VerticalAxis>
        <telerikChart:ScatterPointSeries>
            <telerikChart:ScatterPointSeries.DataPoints>
                <telerikCharting:ScatterDataPoint XValue="1" YValue="1" />
                <telerikCharting:ScatterDataPoint XValue="5" YValue="3" />
                <telerikCharting:ScatterDataPoint XValue="8" YValue="11" />
            </telerikChart:ScatterPointSeries.DataPoints>
        </telerikChart:ScatterPointSeries>
        <telerikChart:RadCartesianChart.Grid>
            <telerikChart:CartesianChartGrid MajorGridLinesVisibility="XY" />
        </telerikChart:RadCartesianChart.Grid>
    </telerikChart:RadCartesianChart>
</Grid>
Figure 1: RadCartesianChart with horizontal and vertical annotations
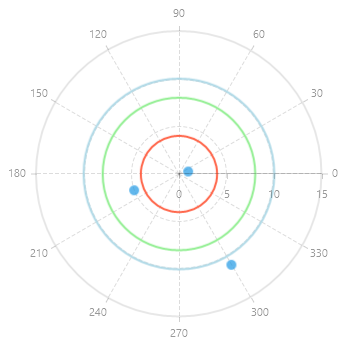
Example of PolarAxisGridLineAnnotation
PolarAxisGridLineAnnotation is represented by concentric circles that cross the radial axis at a specific Value. Example 2 demonstrates how to define PolarAxisGridLineAnnotation in a RadPolarChart.
Example 2: PolarAxisGridLineAnnotation
<Grid xmlns:telerikChart="using:Telerik.UI.Xaml.Controls.Chart"
      xmlns:telerikCharting="using:Telerik.Charting">
    <telerikChart:RadPolarChart Height="350">
        <telerikChart:RadPolarChart.Annotations>
            <telerikChart:PolarAxisGridLineAnnotation Value="4" StrokeThickness="2" Stroke="Tomato"/>
            <telerikChart:PolarAxisGridLineAnnotation Value="8" StrokeThickness="2" Stroke="LightGreen"/>
            <telerikChart:PolarAxisGridLineAnnotation Value="10" StrokeThickness="2" Stroke="LightBlue"/>
        </telerikChart:RadPolarChart.Annotations>

        <telerikChart:RadPolarChart.RadialAxis>
            <telerikChart:NumericalRadialAxis/>
        </telerikChart:RadPolarChart.RadialAxis>
        <telerikChart:RadPolarChart.PolarAxis>
            <telerikChart:PolarAxis/>
        </telerikChart:RadPolarChart.PolarAxis>
        <telerikChart:PolarPointSeries>
            <telerikChart:PolarPointSeries.DataPoints>
                <telerikCharting:PolarDataPoint Value="1" Angle="15" />
                <telerikCharting:PolarDataPoint Value="5" Angle="200" />
                <telerikCharting:PolarDataPoint Value="11" Angle="300" />
            </telerikChart:PolarPointSeries.DataPoints>
        </telerikChart:PolarPointSeries>
        <telerikChart:RadPolarChart.Grid>
            <telerikChart:PolarChartGrid GridLineVisibility="Both" />
        </telerikChart:RadPolarChart.Grid>
    </telerikChart:RadPolarChart>
</Grid>
Figure 2: RadPolarChart with several PolarAxisGridLineAnnotations
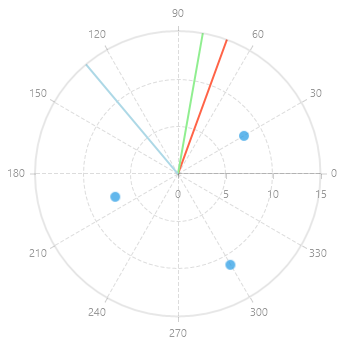
Example of RadialAxisGridLineAnnotation
PolarAxisGridLineAnnotation is represented by lines along the radius of the PolarChart. Example 3 demonstrates how to define a PolarAxisGridLineAnnotation in a RadPolarChatr.
Example 3: RadialAxisGridLineAnnotation
<Grid xmlns:telerikChart="using:Telerik.UI.Xaml.Controls.Chart"
     xmlns:telerikCharting="using:Telerik.Charting">
    <telerikChart:RadPolarChart  Height="350">
        <telerikChart:RadPolarChart.Annotations>
            <telerikChart:RadialAxisGridLineAnnotation Value="70" StrokeThickness="2" Stroke="Tomato"/>
            <telerikChart:RadialAxisGridLineAnnotation Value="80" StrokeThickness="2" Stroke="LightGreen"/>
            <telerikChart:RadialAxisGridLineAnnotation Value="130" StrokeThickness="2" Stroke="LightBlue"/>
        </telerikChart:RadPolarChart.Annotations>

        <telerikChart:RadPolarChart.RadialAxis>
            <telerikChart:NumericalRadialAxis/>
        </telerikChart:RadPolarChart.RadialAxis>
        <telerikChart:RadPolarChart.PolarAxis>
            <telerikChart:PolarAxis/>
        </telerikChart:RadPolarChart.PolarAxis>
        <telerikChart:PolarPointSeries>
            <telerikChart:PolarPointSeries.DataPoints>
                <telerikCharting:PolarDataPoint Value="8" Angle="30" />
                <telerikCharting:PolarDataPoint Value="7" Angle="200" />
                <telerikCharting:PolarDataPoint Value="11" Angle="300" />
            </telerikChart:PolarPointSeries.DataPoints>
        </telerikChart:PolarPointSeries>
        <telerikChart:RadPolarChart.Grid>
            <telerikChart:PolarChartGrid GridLineVisibility="Both" />
        </telerikChart:RadPolarChart.Grid>
    </telerikChart:RadPolarChart>
</Grid>
Figure 3: RadPolarChart with several RadialAxisGridLineAnnotation