Multiple axes
| RELATED VIDEOS | |
|---|---|
| WinForms RadChartView Multi-Axes Support in RadChartView The Multi-Axes feature of RadChartView introduces a whole new realm of data visualization possibilities. Now you can visualize data from multiple sources plotted against a common axis all in the same chart. This allows you to make better decisions with the data, identify patterns and relationships, or simply save form real estate in your application by combining multiple charts into one. |  |
The first is a chart where two or more series share one axis and have different second axes.
The second is a chart where each series has its own pair of axes, the series only share the chart view where they are plotted.
The third one is simply a mix of the previous two.
When in multi axis mode RadChartView will automatically synchronize the color of the axes with the color of the series.
There are several things to consider when setting up a multi axis chart. Each series must have one axis of type First and one of type Second. You have to assign axes to the series before adding them to RadChartView, otherwise default axes will be assigned to the series.
One common axis
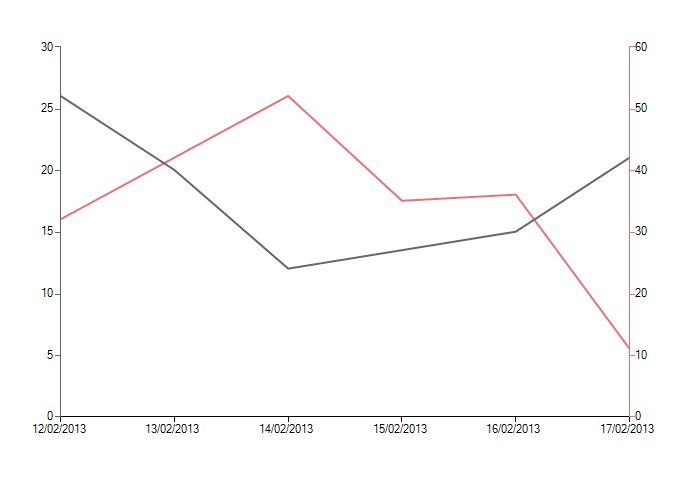
The following example shows how to create a chart with two series sharing their categorical axis. The most common use case for this type of chart is when you have to plot data of different dimensions.
Figure 1: One Common Axis

One Common Axis
DateTimeContinuousAxis horizontalAxis = new DateTimeContinuousAxis();
horizontalAxis.MajorStepUnit = Telerik.Charting.TimeInterval.Day;
horizontalAxis.MajorStep = 1;
horizontalAxis.LabelFormat = "{0:dd/MM/yyyy}";
LinearAxis verticalAxis1 = new LinearAxis();
verticalAxis1.AxisType = AxisType.Second;
LinearAxis verticalAxis2 = new LinearAxis();
verticalAxis2.AxisType = AxisType.Second;
verticalAxis2.HorizontalLocation = AxisHorizontalLocation.Right;
LineSeries line1 = new LineSeries();
line1.HorizontalAxis = horizontalAxis;
line1.VerticalAxis = verticalAxis1;
LineSeries line2 = new LineSeries();
line2.HorizontalAxis = horizontalAxis;
line2.VerticalAxis = verticalAxis2;
line1.DataPoints.Add(new CategoricalDataPoint(26d, DateTime.Now.AddDays(-6)));
line1.DataPoints.Add(new CategoricalDataPoint(20d, DateTime.Now.AddDays(-5)));
line1.DataPoints.Add(new CategoricalDataPoint(12d, DateTime.Now.AddDays(-4)));
line1.DataPoints.Add(new CategoricalDataPoint(15d, DateTime.Now.AddDays(-2)));
line1.DataPoints.Add(new CategoricalDataPoint(21d, DateTime.Now.AddDays(-1)));
line2.DataPoints.Add(new CategoricalDataPoint(32d, DateTime.Now.AddDays(-6)));
line2.DataPoints.Add(new CategoricalDataPoint(52d, DateTime.Now.AddDays(-4)));
line2.DataPoints.Add(new CategoricalDataPoint(35d, DateTime.Now.AddDays(-3)));
line2.DataPoints.Add(new CategoricalDataPoint(36d, DateTime.Now.AddDays(-2)));
line2.DataPoints.Add(new CategoricalDataPoint(11d, DateTime.Now.AddDays(-1)));
this.radChartView1.Series.Add(line1);
this.radChartView1.Series.Add(line2);
Dim horizontalAxis As New DateTimeContinuousAxis()
horizontalAxis.MajorStepUnit = Telerik.Charting.TimeInterval.Day
horizontalAxis.MajorStep = 1
horizontalAxis.LabelFormat = "{0:dd/MM/yyyy}"
Dim verticalAxis1 As New LinearAxis()
verticalAxis1.AxisType = AxisType.Second
Dim verticalAxis2 As New LinearAxis()
verticalAxis2.AxisType = AxisType.Second
verticalAxis2.HorizontalLocation = AxisHorizontalLocation.Right
Dim line1 As New LineSeries()
line1.HorizontalAxis = horizontalAxis
line1.VerticalAxis = verticalAxis1
Dim line2 As New LineSeries()
line2.HorizontalAxis = horizontalAxis
line2.VerticalAxis = verticalAxis2
line1.DataPoints.Add(New CategoricalDataPoint(26.0, DateTime.Now.AddDays(-6)))
line1.DataPoints.Add(New CategoricalDataPoint(20.0, DateTime.Now.AddDays(-5)))
line1.DataPoints.Add(New CategoricalDataPoint(12.0, DateTime.Now.AddDays(-4)))
line1.DataPoints.Add(New CategoricalDataPoint(15.0, DateTime.Now.AddDays(-2)))
line1.DataPoints.Add(New CategoricalDataPoint(21.0, DateTime.Now.AddDays(-1)))
line2.DataPoints.Add(New CategoricalDataPoint(32.0, DateTime.Now.AddDays(-6)))
line2.DataPoints.Add(New CategoricalDataPoint(52.0, DateTime.Now.AddDays(-4)))
line2.DataPoints.Add(New CategoricalDataPoint(35.0, DateTime.Now.AddDays(-3)))
line2.DataPoints.Add(New CategoricalDataPoint(36.0, DateTime.Now.AddDays(-2)))
line2.DataPoints.Add(New CategoricalDataPoint(11.0, DateTime.Now.AddDays(-1)))
Me.radChartView1.Series.Add(line1)
Me.radChartView1.Series.Add(line2)
Each series with own axes
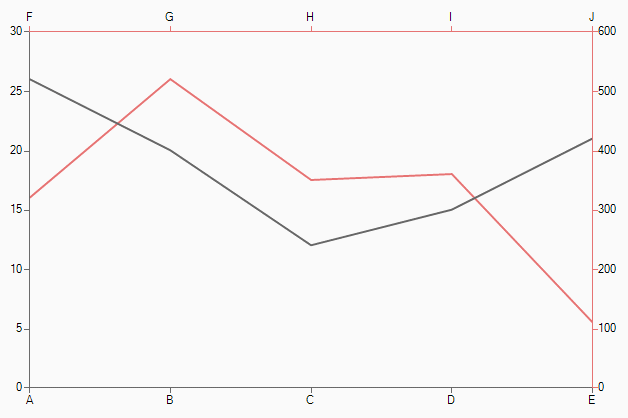
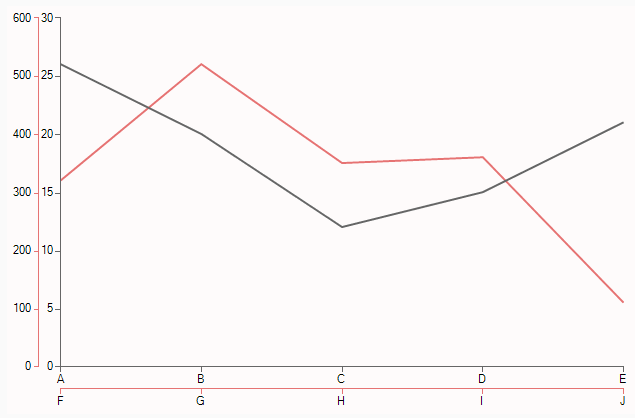
If you need series to have different axes but still plot them on one chart view you can assign the axes to the series and add them to the chart view
Figure 2: All Sides

Figure 3: Two Sides

Setup Four Axes
CategoricalAxis horizontalAxis1 = new CategoricalAxis();
CategoricalAxis horizontalAxis2 = new CategoricalAxis();
horizontalAxis2.VerticalLocation = AxisVerticalLocation.Top;
LinearAxis verticalAxis1 = new LinearAxis();
verticalAxis1.AxisType = AxisType.Second;
LinearAxis verticalAxis2 = new LinearAxis();
verticalAxis2.AxisType = AxisType.Second;
verticalAxis2.HorizontalLocation = AxisHorizontalLocation.Right;
LineSeries line1 = new LineSeries();
line1.HorizontalAxis = horizontalAxis1;
line1.VerticalAxis = verticalAxis1;
LineSeries line2 = new LineSeries();
line2.HorizontalAxis = horizontalAxis2;
line2.VerticalAxis = verticalAxis2;
line1.DataPoints.Add(new CategoricalDataPoint(26d, "A"));
line1.DataPoints.Add(new CategoricalDataPoint(20d, "B"));
line1.DataPoints.Add(new CategoricalDataPoint(12d, "C"));
line1.DataPoints.Add(new CategoricalDataPoint(15d, "D"));
line1.DataPoints.Add(new CategoricalDataPoint(21d, "E"));
line2.DataPoints.Add(new CategoricalDataPoint(320d, "F"));
line2.DataPoints.Add(new CategoricalDataPoint(520d, "G"));
line2.DataPoints.Add(new CategoricalDataPoint(350d, "H"));
line2.DataPoints.Add(new CategoricalDataPoint(360d, "I"));
line2.DataPoints.Add(new CategoricalDataPoint(110d, "J"));
this.radChartView1.Series.Add(line1);
this.radChartView1.Series.Add(line2);
Dim horizontalAxis1 As New CategoricalAxis()
Dim horizontalAxis2 As New CategoricalAxis()
horizontalAxis2.VerticalLocation = AxisVerticalLocation.Top
Dim verticalAxis1 As New LinearAxis()
verticalAxis1.AxisType = AxisType.Second
Dim verticalAxis2 As New LinearAxis()
verticalAxis2.AxisType = AxisType.Second
verticalAxis2.HorizontalLocation = AxisHorizontalLocation.Right
Dim line1 As New LineSeries()
line1.HorizontalAxis = horizontalAxis1
line1.VerticalAxis = verticalAxis1
Dim line2 As New LineSeries()
line2.HorizontalAxis = horizontalAxis2
line2.VerticalAxis = verticalAxis2
line1.DataPoints.Add(New CategoricalDataPoint(26.0, "A"))
line1.DataPoints.Add(New CategoricalDataPoint(20.0, "B"))
line1.DataPoints.Add(New CategoricalDataPoint(12.0, "C"))
line1.DataPoints.Add(New CategoricalDataPoint(15.0, "D"))
line1.DataPoints.Add(New CategoricalDataPoint(21.0, "E"))
line2.DataPoints.Add(New CategoricalDataPoint(320.0, "F"))
line2.DataPoints.Add(New CategoricalDataPoint(520.0, "G"))
line2.DataPoints.Add(New CategoricalDataPoint(350.0, "H"))
line2.DataPoints.Add(New CategoricalDataPoint(360.0, "I"))
line2.DataPoints.Add(New CategoricalDataPoint(110.0, "J"))
Me.radChartView1.Series.Add(line1)
Me.radChartView1.Series.Add(line2)
Mixed multi axes
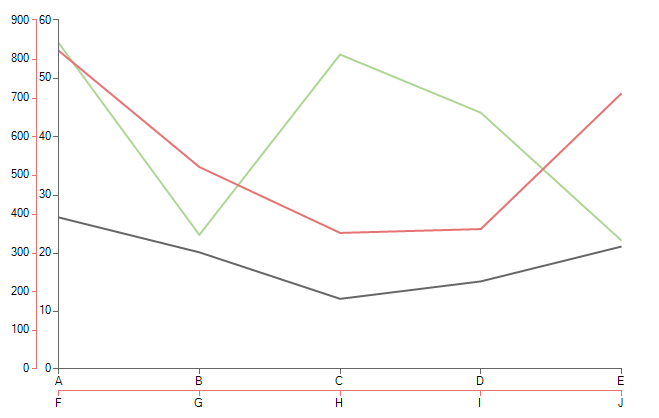
Mixing the above two modes:
Figure 4: Mixed Multi Axes

CategoricalAxis horizontalAxis1 = new CategoricalAxis();
CategoricalAxis horizontalAxis2 = new CategoricalAxis();
LinearAxis verticalAxis1 = new LinearAxis();
verticalAxis1.AxisType = AxisType.Second;
LinearAxis verticalAxis2 = new LinearAxis();
verticalAxis2.AxisType = AxisType.Second;
LinearAxis verticalAxis3 = new LinearAxis();
verticalAxis3.AxisType = AxisType.Second;
LineSeries line1 = new LineSeries();
line1.HorizontalAxis = horizontalAxis1;
line1.VerticalAxis = verticalAxis1;
LineSeries line2 = new LineSeries();
line2.HorizontalAxis = horizontalAxis2;
line2.VerticalAxis = verticalAxis2;
LineSeries line3 = new LineSeries();
line3.HorizontalAxis = horizontalAxis1;
line3.VerticalAxis = verticalAxis1;
line1.DataPoints.Add(new CategoricalDataPoint(26d, "A"));
line1.DataPoints.Add(new CategoricalDataPoint(20d, "B"));
line1.DataPoints.Add(new CategoricalDataPoint(12d, "C"));
line1.DataPoints.Add(new CategoricalDataPoint(15d, "D"));
line1.DataPoints.Add(new CategoricalDataPoint(21d, "E"));
line2.DataPoints.Add(new CategoricalDataPoint(820d, "F"));
line2.DataPoints.Add(new CategoricalDataPoint(520d, "G"));
line2.DataPoints.Add(new CategoricalDataPoint(350d, "H"));
line2.DataPoints.Add(new CategoricalDataPoint(360d, "I"));
line2.DataPoints.Add(new CategoricalDataPoint(710d, "J"));
line3.DataPoints.Add(new CategoricalDataPoint(56d, "A"));
line3.DataPoints.Add(new CategoricalDataPoint(23d, "B"));
line3.DataPoints.Add(new CategoricalDataPoint(54d, "C"));
line3.DataPoints.Add(new CategoricalDataPoint(44d, "D"));
line3.DataPoints.Add(new CategoricalDataPoint(22d, "E"));
this.radChartView1.Series.Add(line1);
this.radChartView1.Series.Add(line2);
this.radChartView1.Series.Add(line3);
Dim horizontalAxis1 As New CategoricalAxis()
Dim horizontalAxis2 As New CategoricalAxis()
Dim verticalAxis1 As New LinearAxis()
verticalAxis1.AxisType = AxisType.Second
Dim verticalAxis2 As New LinearAxis()
verticalAxis2.AxisType = AxisType.Second
Dim verticalAxis3 As New LinearAxis()
verticalAxis3.AxisType = AxisType.Second
Dim line1 As New LineSeries()
line1.HorizontalAxis = horizontalAxis1
line1.VerticalAxis = verticalAxis1
Dim line2 As New LineSeries()
line2.HorizontalAxis = horizontalAxis2
line2.VerticalAxis = verticalAxis2
Dim line3 As New LineSeries()
line3.HorizontalAxis = horizontalAxis1
line3.VerticalAxis = verticalAxis1
line1.DataPoints.Add(New CategoricalDataPoint(26.0, "A"))
line1.DataPoints.Add(New CategoricalDataPoint(20.0, "B"))
line1.DataPoints.Add(New CategoricalDataPoint(12.0, "C"))
line1.DataPoints.Add(New CategoricalDataPoint(15.0, "D"))
line1.DataPoints.Add(New CategoricalDataPoint(21.0, "E"))
line2.DataPoints.Add(New CategoricalDataPoint(820.0, "F"))
line2.DataPoints.Add(New CategoricalDataPoint(520.0, "G"))
line2.DataPoints.Add(New CategoricalDataPoint(350.0, "H"))
line2.DataPoints.Add(New CategoricalDataPoint(360.0, "I"))
line2.DataPoints.Add(New CategoricalDataPoint(710.0, "J"))
line3.DataPoints.Add(New CategoricalDataPoint(56.0, "A"))
line3.DataPoints.Add(New CategoricalDataPoint(23.0, "B"))
line3.DataPoints.Add(New CategoricalDataPoint(54.0, "C"))
line3.DataPoints.Add(New CategoricalDataPoint(44.0, "D"))
line3.DataPoints.Add(New CategoricalDataPoint(22.0, "E"))
Me.radChartView1.Series.Add(line1)
Me.radChartView1.Series.Add(line2)
Me.radChartView1.Series.Add(line3)