DateTime
RadChartView supports two DateTime axes out of the box – DateTimeCategorical and DateTimeContinuous. While the former is a categorical axis, the latter is a numerical one. They both sort their data chronologically.
DateTimeCategorical Axis
The DateTime categorical axis is a categorical axis with Date-Time values sorted chronologically. It also allows definition of categories based on specific date time components – year, month, day etc. For example, if data values fall in the range of one year, the points can be plotted in categories for each month. If data values fall in the range of one month, the values can be categorized by days. Here is a list of its most important properties:
DateTimeComponent: Determines the component from the DateTime that will be used to build categories. Possible values are Ticks, Year, Quarter, Month, Week, Hour, Minute, Second, Millisecond, Date, TimeOfDay, Day, DayOfWeek, DayOfYear.
GapLength: Gets or sets the gap (in the range [0, 1]) to be applied when calculating each plotted Cartesian series position.
PlotMode: Determines the AxisPlotMode used to by the axis to plot the data. Possible values are BetweenTicks, OnTicks, OnTicksPadded. BetweenTicks plots points in the middle of the range, defined by two ticks. OnTicks plots the points over each tick. OnTicksPadded plots points over each tick with half a step padding applied on both ends of the axis.
MajorTickInterval: Defines the step at which ticks are positioned. The value indicates that the first of n axis ticks is visible, where n is the value of the property.
HorizontalLocation: The property determines the horizontal location of the axis in relation to the plot area. Possible values are Top and Bottom, where Top displays the axis above the area and Bottom displays the axis below the area. The default value is Bottom.
VerticalLocation: The property determines the vertical location of the axis in relation to the plot area. Possible values are Left and Right, where Left displays the axis on the left of the area and Right displays the axis on the right of the area. The default value is Left.
ClipLabels: This property controls whether labels will be clipped to the size of the axes (width/height).
Additionally, DateTimeCategoricalAxis inherits all properties of the Axis class.
DateTimeCategorical axis is not added by default to Cartesian series. For this reason you will need to create an instance of the DateTimeCategoricalAxis class and assign it to the HorizontalAxis property of the series, before series is added to the chart. Here is a sample snippet:
DateTimeCategoricalAxis Setup
LineSeries series = new LineSeries();
series.DataPoints.Add(new CategoricalDataPoint(6, DateTime.Now));
series.DataPoints.Add(new CategoricalDataPoint(4, DateTime.Now.AddDays(1)));
series.DataPoints.Add(new CategoricalDataPoint(7, DateTime.Now.AddDays(2)));
series.DataPoints.Add(new CategoricalDataPoint(5, DateTime.Now.AddDays(3)));
DateTimeCategoricalAxis categoricalAxis = new DateTimeCategoricalAxis();
categoricalAxis.DateTimeComponent = DateTimeComponent.Day;
categoricalAxis.PlotMode = AxisPlotMode.BetweenTicks;
categoricalAxis.LabelFormat = "{0:m}";
//First assign the axis to the VerticalAxis property and then add the series to the chart
series.HorizontalAxis = categoricalAxis;
radChartView1.Series.Add(series);
Dim series As New LineSeries()
series.DataPoints.Add(New CategoricalDataPoint(6, DateTime.Now))
series.DataPoints.Add(New CategoricalDataPoint(4, DateTime.Now.AddDays(1)))
series.DataPoints.Add(New CategoricalDataPoint(7, DateTime.Now.AddDays(2)))
series.DataPoints.Add(New CategoricalDataPoint(5, DateTime.Now.AddDays(3)))
Dim categoricalAxis As New DateTimeCategoricalAxis()
categoricalAxis.DateTimeComponent = DateTimeComponent.Day
categoricalAxis.PlotMode = AxisPlotMode.BetweenTicks
categoricalAxis.LabelFormat = "{0:m}"
'First assign the axis to the VerticalAxis property and then add the series to the chart
series.HorizontalAxis = categoricalAxis
RadChartView1.Series.Add(series)
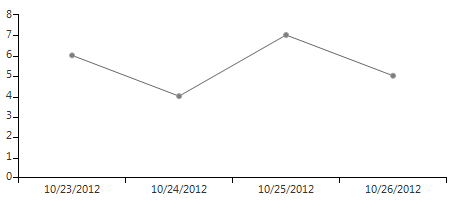
Figure 1: DateTimeCategoricalAxis Setup
DateTimeContinuous Axis
The DateTimeContinuous axis is a numerical axis that plots chronologically sorted DateTime values. Here is a list of its properties:
MaximumTicks: Gets or sets the maximum ticks that might be displayed on the axis. This property is useful in some corner cases when ticks may become a really big number.
MajorStep: Defines the step between two adjacent ticks on the axis. Specify TimeSpan.Zero to clear the value. If not specified, the step is automatically determined, depending on the smallest difference between any two dates.
MajorStepUnit: Specifies the unit that defines the custom major step of the axis. If no explicit step is defined, the axis automatically calculates one, depending on the smallest difference between any two dates.
Minimum: Gets or sets the custom minimum of the axis. Specify DateTime.MinValue to clear the property value so that the minimum is calculated automatically.
Maximum: Gets or sets the custom maximum of the axis. Specify DateTime.MaxValue to clear the property value so that the maximum is calculated automatically.
GapLength: Gets or sets the gap (in the range [0, 1]) to be applied when calculating each plotted Cartesian series position.
PlotMode: Determines the AxisPlotMode used to by the axis to plot the data. Possible values are BetweenTicks, OnTicks, OnTicksPadded. BetweenTicks plots points in the middle of the range, defined by two ticks. OnTicks plots the points over each tick. OnTicksPadded plots points over each tick with half a step padding applied on both ends of the axis.
HorizontalLocation: The property determines the horizontal location of the axis in relation to the plot area. Possible values are Top and Bottom, where Top displays the axis above the area and Bottom displays the axis below the area. The default value is Bottom.
VerticalLocation: The property determines the vertical location of the axis in relation to the plot area. Possible values are Left and Right, where Left displays the axis on the left of the area and Right displays the axis on the right of the area. The default value is Left.
Additionally, DateTimeContinuousAxis inherits all properties of the Axis class.
DateTimeContinuous axis is not added by default to Cartesian series. For this reason you will need to create an instance of the DateTimeContinuousAxis class and assign it to the HorizontalAxis property of the series, before series is added to the chart. Here is a sample snippet:
DateTimeContinuousAxis Setup
LineSeries lineSeries = new LineSeries();
lineSeries.DataPoints.Add(new CategoricalDataPoint(6, DateTime.Now));
lineSeries.DataPoints.Add(new CategoricalDataPoint(4, DateTime.Now.AddDays(1)));
lineSeries.DataPoints.Add(new CategoricalDataPoint(7, DateTime.Now.AddDays(2)));
lineSeries.DataPoints.Add(new CategoricalDataPoint(5, DateTime.Now.AddDays(3)));
DateTimeContinuousAxis continuousAxis = new DateTimeContinuousAxis();
continuousAxis.PlotMode = AxisPlotMode.BetweenTicks;
continuousAxis.LabelFormat = "{0:d}";
//First assign the axis to the VerticalAxis property and then add the series to the chart
lineSeries.HorizontalAxis = continuousAxis;
radChartView1.Series.Add(lineSeries);
Dim lineSeries As New LineSeries()
lineSeries.DataPoints.Add(New CategoricalDataPoint(6, DateTime.Now))
lineSeries.DataPoints.Add(New CategoricalDataPoint(4, DateTime.Now.AddDays(1)))
lineSeries.DataPoints.Add(New CategoricalDataPoint(7, DateTime.Now.AddDays(2)))
lineSeries.DataPoints.Add(New CategoricalDataPoint(5, DateTime.Now.AddDays(3)))
Dim continuousAxis As New DateTimeContinuousAxis()
continuousAxis.PlotMode = AxisPlotMode.BetweenTicks
continuousAxis.LabelFormat = "{0:d}"
'First assign the axis to the VerticalAxis property and then add the series to the chart
lineSeries.HorizontalAxis = continuousAxis
RadChartView1.Series.Add(lineSeries)
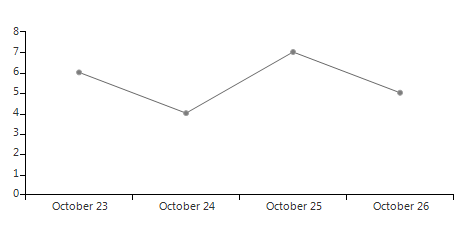
Figure 2: DateTimeContinuousAxis Setup Setup