Palettes
RadChartView3D has a built-in automatic coloring mechanism. There are predefined palettes containing 3D materials used to define the textures of the chart data points.
Here are all of the predefined chart palettes:
| Name | Pallete |
|---|---|
| Arctic | |
| Autumn | |
| Cold | |
| Flower | |
| Forest | |
| Grayscale | |
| Ground | |
| Lilac | |
| Natural | |
| Pastel | |
| Rainbow | |
| Spring | |
| Summer | |
| Warm | |
| Windows8 | |
| Office2013 | |
| VisualStudio2013 | |
| Green | |
| Office2016 | |
| Material | |
| Fluent | |
| Crystal | |
| VisualStudio2019 |
A palette can be set via the Palette property of the chart. The property is of type System.Windows.Media.Media3D.MaterialCollection so you can easily create a custom palette.
Example 1: Setting a palette in XAML
<telerik:RadCartesianChart3D Palette="Windows8" />
Example 2: Setting a palette in code
chart.Palette = Chart3DPalettes.Windows8;
Figure 2: Chart with 3 BarSeries3D colored using the Windows8 palette
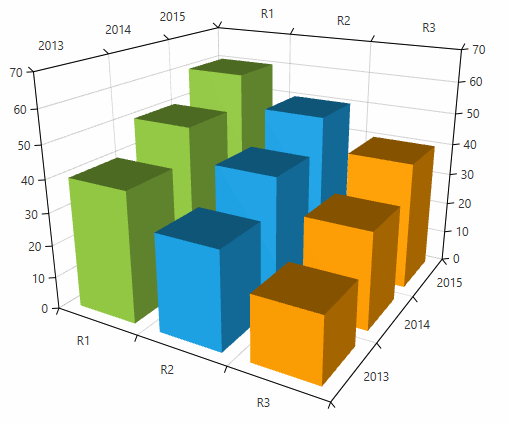
The DefaultVisualMaterial property of the series has a higher precedence than the palette materials.
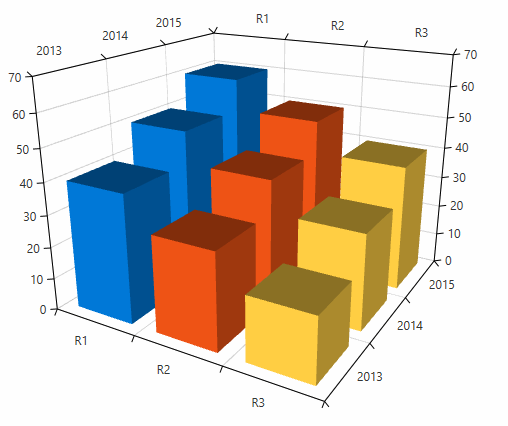
Create a custom palette
The chart allows you to create a custom palette by defining a MaterialCollection and populating it with System.Windows.Media.Media3D.Material objects. The new collection can be assinged to the Palette property of the chart.
Example 3: Defining a custom palette
<FrameworkElement.Resources>
    <MaterialCollection x:Key="customPalette">
        <DiffuseMaterial Brush="#0078D7"/>
        <DiffuseMaterial Brush="#EE5315"/>
        <DiffuseMaterial Brush="#FFCE43"/>
    </MaterialCollection>
</FrameworkElement.Resources>
Example 4: Applying the custom palette
<telerik:RadCartesianChart3D Palette="{StaticResource customPalette}">
Example 5: Complete example of setting a custom palette
<Grid>
    <FrameworkElement.Resources>
        <MaterialCollection x:Key="customPalette">
            <DiffuseMaterial Brush="#0078D7"/>
            <DiffuseMaterial Brush="#EE5315"/>
            <DiffuseMaterial Brush="#FFCE43"/>
        </MaterialCollection>
    </FrameworkElement.Resources>
    <telerik:RadCartesianChart3D Palette="{StaticResource customPalette}">
        <telerik:RadCartesianChart3D.XAxis>
            <telerik:CategoricalAxis3D />
        </telerik:RadCartesianChart3D.XAxis>
        <telerik:RadCartesianChart3D.YAxis>
            <telerik:CategoricalAxis3D />
        </telerik:RadCartesianChart3D.YAxis>
        <telerik:RadCartesianChart3D.ZAxis>
            <telerik:LinearAxis3D />
        </telerik:RadCartesianChart3D.ZAxis>
        <telerik:RadCartesianChart3D.Series>
            <telerik:BarSeries3D>
                <telerik:BarSeries3D.DataPoints>
                    <telerik:XyzDataPoint3D XValue="R1" YValue="2013" ZValue="40" />
                    <telerik:XyzDataPoint3D XValue="R1" YValue="2014" ZValue="50" />
                    <telerik:XyzDataPoint3D XValue="R1" YValue="2015" ZValue="60" />
                </telerik:BarSeries3D.DataPoints>
            </telerik:BarSeries3D>
            <telerik:BarSeries3D>
                <telerik:BarSeries3D.DataPoints>
                    <telerik:XyzDataPoint3D XValue="R2" YValue="2013" ZValue="30" />
                    <telerik:XyzDataPoint3D XValue="R2" YValue="2014" ZValue="40" />
                    <telerik:XyzDataPoint3D XValue="R2" YValue="2015" ZValue="50" />
                </telerik:BarSeries3D.DataPoints>
            </telerik:BarSeries3D>
            <telerik:BarSeries3D>
                <telerik:BarSeries3D.DataPoints>
                    <telerik:XyzDataPoint3D XValue="R3" YValue="2013" ZValue="20" />
                    <telerik:XyzDataPoint3D XValue="R3" YValue="2014" ZValue="30" />
                    <telerik:XyzDataPoint3D XValue="R3" YValue="2015" ZValue="40" />
                </telerik:BarSeries3D.DataPoints>
            </telerik:BarSeries3D>
        </telerik:RadCartesianChart3D.Series>
        <telerik:RadCartesianChart3D.Grid>
            <telerik:CartesianChart3DGrid />
        </telerik:RadCartesianChart3D.Grid>
    </telerik:RadCartesianChart3D>
</Grid>
Figure 3: Chart with custom palette