CartesianChart3DGrid
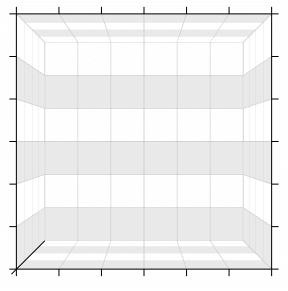
CartesianChart3DGrid is used to decorate the 3D Cartesian chart with grid lines and strip lines placed over the planes (sides) of the plot area.
Figure 1: CartesianChart3DGrid
Setting up the grid
To enable the grid, set the Grid property of the RadCartesianChart3D control to an instance of the CartesianChart3DGrid class (see Example 1).
Example 1: Setting up the grid
<telerik:RadCartesianChart3D.Grid>
    <telerik:CartesianChart3DGrid/>
</telerik:RadCartesianChart3D.Grid>
Figure 2: Grid lines
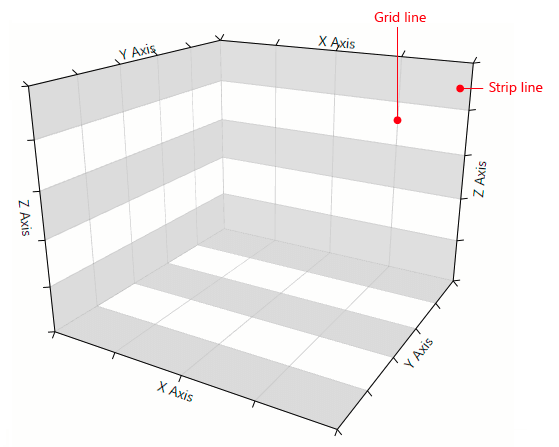
By default only the grid lines of the plot area planes are displayed. The strip lines are not shown.
Setting up the grid and strip lines
CartesianChart3DGrid allows you to specify the visibility of the grid lines and strip lines of each plane. You can also set their materials and the stroke thickness of the grid lines.
Figure 3: Plot area planes
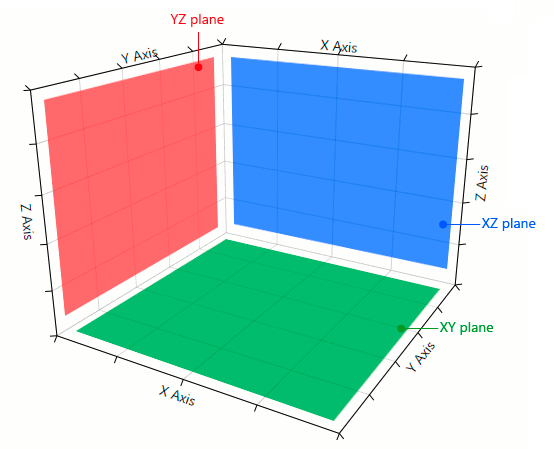
To set the visibility of the grid and strip lines you can use the following properties.
- XYGridLinesVisibility and XYStripLinesVisibility for the lines in the XY plane.
- XZGridLinesVisibility and XZStripLinesVisibility for the lines in the XZ plane.
- YZGridLinesVisibility and YZStripLinesVisibility for the lines in the YZ plane.
Example 2: Setting lines visibility
    <telerik:CartesianChart3DGrid XZGridLinesVisibility="All"
                                  YZGridLinesVisibility="All"
                                  XYGridLinesVisibility="All"
                                  XYStripLinesVisibility="All"
                                  XZStripLinesVisibility="All"
                                  YZStripLinesVisibility="All">
Customizing the grid and strip lines
CartesianChart3DGrid allows you to define custom materials for the grid and strip lines. Also, you can set the stroke thickness of the grid lines.
To set the stroke thickness of the grid lines you can use the GridLineThickness property.
Example 3: Setting line stroke thickness
<telerik:CartesianChart3DGrid GridLineThickness="5" />
- XGridLinesMaterials and XStripLinesMaterials for the lines that originate from the X axis.
- YGridLinesMaterials and YStripLinesMaterials for the lines that originate from the Y axis.
- ZGridLinesMaterials and ZStripLinesMaterials for the lines that originate from the Z axis.
Example 4: Setting X grid lines material
<telerik:CartesianChart3DGrid>
    <telerik:CartesianChart3DGrid.XGridLinesMaterials>
        <MaterialCollection>
            <DiffuseMaterial Brush="#00A2E8" />
         </MaterialCollection>
    </telerik:CartesianChart3DGrid.XGridLinesMaterials>
</telerik:CartesianChart3DGrid>
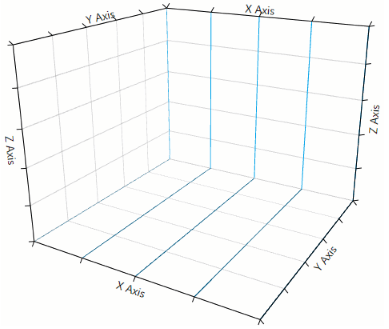
Figure 4: Colored grid lines
Example 5: Setting Y grid lines material
<telerik:CartesianChart3DGrid>
    <telerik:CartesianChart3DGrid.YGridLinesMaterials>
        <MaterialCollection>
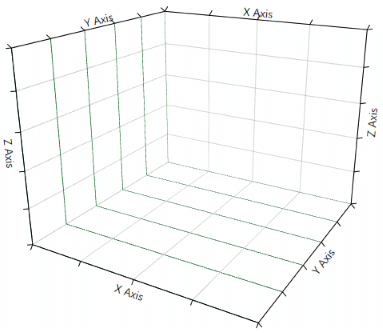
            <DiffuseMaterial Brush="#22B14C" />
        </MaterialCollection>
    </telerik:CartesianChart3DGrid.YGridLinesMaterials>
</telerik:CartesianChart3DGrid>
Figure 5: Colored grid lines
Example 6: Setting Z grid lines material
<telerik:CartesianChart3DGrid>
    <telerik:CartesianChart3DGrid.ZGridLinesMaterials>
        <MaterialCollection>
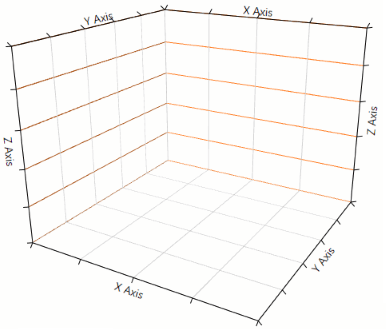
            <DiffuseMaterial Brush="#FF7F27" />
         </MaterialCollection>
    </telerik:CartesianChart3DGrid.ZGridLinesMaterials>
</telerik:CartesianChart3DGrid>
Figure 6: Colored grid lines
The strip lines materials are set up using the same manner as in Examples from 4 to 6.