Tooltips
The HeatMap provides a tooltip behavior which visualizes arbitrary information related to a data point.
The tooltip functionality is disabled by default. To enable it, set the ShowToolTips property of the HeatMap to true.
Enable the tooltip behavior of the HeatMap
<telerik:RadHeatMap ShowToolTips="True" />
Customizing the Tooltip
To customize the appearance of the tooltip, use the ToolTipSettings property of the RadHeatMap. It is of type HeatMapToolTipSettings and exposes the following properties:
-
ToolTipTemplate—The template that will be used for the tooltips. -
ShowDuration—A value that determines how long the tooltip will be visible before disappearing. -
InitialShowDelay—The length of time before a tooltip opens. -
Placement—The orientation of the tooltip when it opens. Specifies the behavior of the tooltip when it overlaps screen boundaries. -
PlacementRectangle—The rectangular area relative to which the tooltip is positioned. -
PlacementTarget—The object relative to which the tooltip is positioned. -
HorizontalOffset—The offset from the left of the area that is specified for the tooltip by thePlacementRectangleandPlacementTargetproperties. -
VerticalOffset—The distance from the top of the area that is specified for the tooltip by thePlacementRectangleandPlacementTargetproperties. -
ToolTipFormat—The tooltip format string.
Implementing the Tooltip in the HeatMap
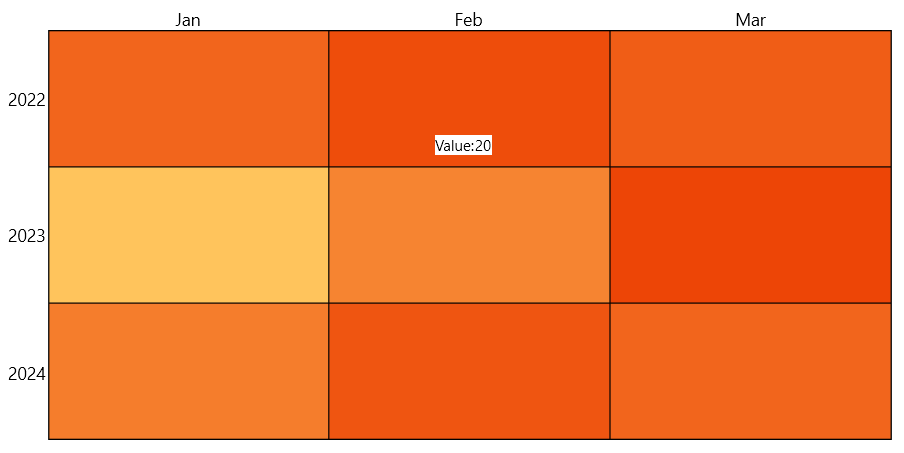
For the purposes of this article, you'll use the TempInfo and ViewModel classes from the article on populating the HeatMap with data. After having the sample data ready, go to the XAML code and define the HeatMap and the ToolTipSettings.
Customize the tooltip
<Grid>
    <Grid.DataContext>
        <local:ViewModel />
    </Grid.DataContext>
    <telerik:RadHeatMap ShowToolTips="True" CellBorderColor="Black" CellBorderThickness="1">
        <telerik:RadHeatMap.ToolTipSettings>
            <telerik:HeatMapToolTipSettings ShowDuration="5000" InitialShowDelay="2000">
                <telerik:HeatMapToolTipSettings.ToolTipTemplate>
                    <DataTemplate>
                        <StackPanel Orientation="Horizontal" Background="White">
                            <TextBlock Text="Value: " FontSize="12"/>
                            <TextBlock Text="{Binding Value}" FontSize="12"/>
                        </StackPanel>
                    </DataTemplate>
                </telerik:HeatMapToolTipSettings.ToolTipTemplate>
            </telerik:HeatMapToolTipSettings>
        </telerik:RadHeatMap.ToolTipSettings>
        <telerik:RadHeatMap.Definition>
            <telerik:CategoricalDefinition x:Name="categoricalDefinition" ItemsSource="{Binding TempInfos}"
                                RowGroupMemberPath="Year"
                                ColumnGroupMemberPath="Month"
                                ValuePath="Temperature" />
        </telerik:RadHeatMap.Definition>
        <telerik:RadHeatMap.RowHeaderSettings>
            <telerik:HeatMapRowHeaderSettings LabelFormat="yyyy"/>
        </telerik:RadHeatMap.RowHeaderSettings>
    </telerik:RadHeatMap>
</Grid>