Binding Legend to Chart
The legend control can be bound to the chart using the LegendProvider property. This article shows how to use the property with a Cartesian and Pie charts.
Binding to CartesianChart
Defining the Cartesian data point model
public class BodyWeight
{
    private static Random r = new Random();
    public DateTime EntryDateTime { get; set; }
    public double Weight { get; set; }

    public static ObservableCollection<BodyWeight> GetWeightList()
    {
        return new ObservableCollection<BodyWeight>
        {
            new BodyWeight { EntryDateTime = DateTime.Now, Weight = r.Next(50, 60) },
            new BodyWeight { EntryDateTime = DateTime.Now.AddDays(1), Weight = r.Next(50, 60) },
            new BodyWeight { EntryDateTime = DateTime.Now.AddDays(2), Weight = r.Next(50, 60) },
            new BodyWeight { EntryDateTime = DateTime.Now.AddDays(3), Weight = r.Next(50, 60) },
            new BodyWeight { EntryDateTime = DateTime.Now.AddDays(4), Weight = r.Next(50, 60) },
            new BodyWeight { EntryDateTime = DateTime.Now.AddDays(5), Weight = r.Next(50, 60) }
        };
    }
}
Defining the Cartesian chart view model
public class MainViewModel
{
    public MainViewModel()
    {
        this.Data1 = BodyWeight.GetWeightList();
        this.Data2 = BodyWeight.GetWeightList();
    }

    public ObservableCollection<BodyWeight> Data1 { get; set; }
    public ObservableCollection<BodyWeight> Data2 { get; set; }
}
Defining the RadCartesianChart and RadLegendControl
<Grid xmlns:telerikChart="using:Telerik.UI.Xaml.Controls.Chart"
      xmlns:telerikPrimitives="using:Telerik.UI.Xaml.Controls.Primitives">
    <telerikChart:RadCartesianChart x:Name="chart">
        <telerikChart:RadCartesianChart.DataContext>
            <local:MainViewModel/>
        </telerikChart:RadCartesianChart.DataContext>
        <telerikChart:RadCartesianChart.Grid>
            <telerikChart:CartesianChartGrid MajorLinesVisibility="XY"/>
        </telerikChart:RadCartesianChart.Grid>
        <telerikChart:RadCartesianChart.VerticalAxis>
            <telerikChart:LinearAxis/>
        </telerikChart:RadCartesianChart.VerticalAxis>
        <telerikChart:RadCartesianChart.HorizontalAxis>
            <telerikChart:DateTimeCategoricalAxis LabelFormat="{}{0:dd-MMM}" DateTimeComponent="Day"/>
        </telerikChart:RadCartesianChart.HorizontalAxis>

        <telerikChart:AreaSeries ValueBinding="Weight" CategoryBinding="EntryDateTime"
                                 ItemsSource="{Binding Data1}" CombineMode="Stack" LegendTitle="Data 1" />
        <telerikChart:AreaSeries ValueBinding="Weight" CategoryBinding="EntryDateTime"
                                 ItemsSource="{Binding Data2}"  CombineMode="Stack" LegendTitle="Data 2" />
    </telerikChart:RadCartesianChart>
    <telerikPrimitives:RadLegendControl LegendProvider="{Binding ElementName=chart}"/>
</Grid>

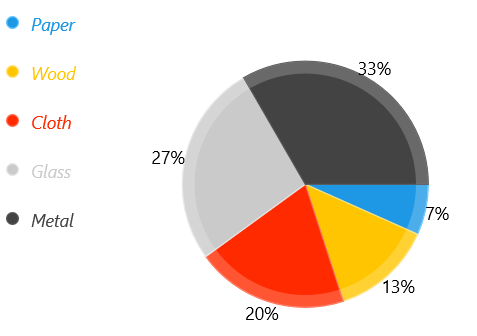
Binding to PieChart
Defining the Pie data point model
public class Data
{
    public int Amount { get; set; }
    public string Category { get; set; }
}
Populating the Pie chart with data
string[] category = new string[5] { "Paper", "Wood", "Cloth", "Glass", "Metal" };
this.chart.DataContext = Enumerable.Range(1, 5).Select(x => new Data { Amount = 10 * x, Category = category[x - 1] }).ToList();
Defining the RadPieChart and RadLegendControl
<Grid xmlns:telerikChart="using:Telerik.UI.Xaml.Controls.Chart"
      xmlns:telerikPrimitives="using:Telerik.UI.Xaml.Controls.Primitives">
    <telerikChart:RadPieChart x:Name="chart">
        <telerikChart:PieSeries ItemsSource="{Binding}" RadiusFactor="0.8">
            <telerikChart:PieSeries.ValueBinding>
                <telerikChart:PropertyNameDataPointBinding PropertyName="Amount"/>
            </telerikChart:PieSeries.ValueBinding>
            <telerikChart:PieSeries.LegendTitleBinding >
                <telerikChart:PropertyNameDataPointBinding PropertyName="Category"/>
            </telerikChart:PieSeries.LegendTitleBinding>
        </telerikChart:PieSeries>
    </telerikChart:RadPieChart>
    <telerikPrimitives:RadLegendControl LegendProvider="{Binding ElementName=chart}" >
        <telerikPrimitives:RadLegendControl.ItemsPanel>
            <ItemsPanelTemplate>
                <StackPanel Orientation="Vertical"/>
            </ItemsPanelTemplate>
        </telerikPrimitives:RadLegendControl.ItemsPanel>
        <telerikPrimitives:RadLegendControl.ItemTemplate>
            <DataTemplate>
                <StackPanel Orientation="Horizontal">
                    <Ellipse Fill="{Binding Fill}" Stroke="{Binding Stroke}"
                             StrokeThickness="1" Width="10" Height="10"/>
                    <TextBlock Text="{Binding Title}" Foreground="{Binding Fill}"
                               Margin="10" FontStyle="Italic"/>
                </StackPanel>
            </DataTemplate>
        </telerikPrimitives:RadLegendControl.ItemTemplate>
    </telerikPrimitives:RadLegendControl>
</Grid>