ScatterRangeBarSeries
This series visualizes a set of rectangles (bars) representing each of the data points. The bars have numeric meaning in both directions - horizontal and vertical - and each bar is defined by horizontal and vertical start, and end values. This series can be used to create histogram visualization.
Declaratively Defined Series
The following example shows how to define ScatterRangeBarSeries and populate its DataPoints collection.
Declaring a RangeBarSeries in XAML
<telerikChart:RadCartesianChart>
<telerikChart:RadCartesianChart.HorizontalAxis>
<telerikChart:LinearAxis />
</telerikChart:RadCartesianChart.HorizontalAxis>
<telerikChart:RadCartesianChart.VerticalAxis>
<telerikChart:LinearAxis />
</telerikChart:RadCartesianChart.VerticalAxis>
<telerikChart:RadCartesianChart.Grid>
<telerikChart:CartesianChartGrid MajorGridLinesVisibility="Y" />
</telerikChart:RadCartesianChart.Grid>
<telerikChart:ScatterRangeBarSeries>
<telerikChart:ScatterRangeBarSeries.DataPoints>
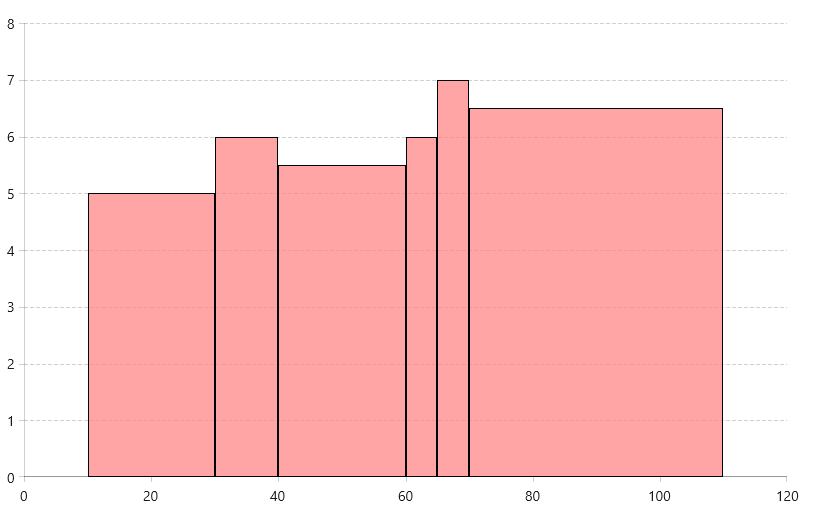
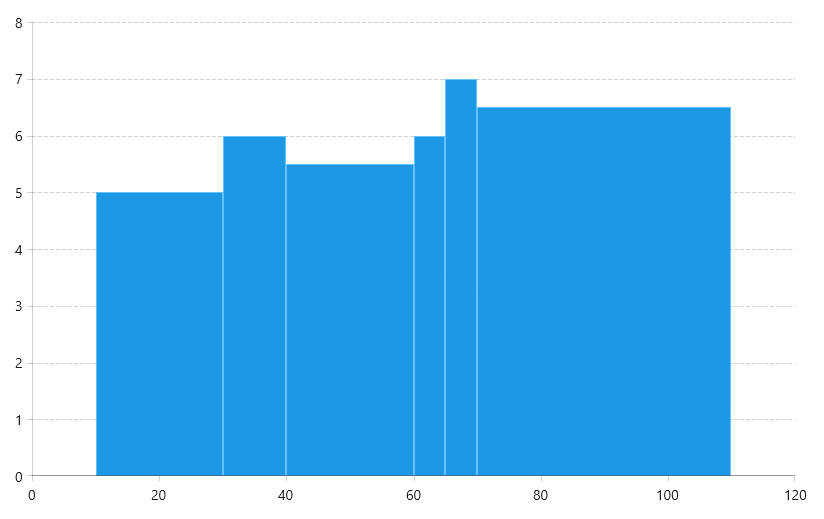
<telerikCharting:ScatterRangeDataPoint HorizontalLow="10" HorizontalHigh="30" VerticalLow="0" VerticalHigh="5"/>
<telerikCharting:ScatterRangeDataPoint HorizontalLow="30" HorizontalHigh="40" VerticalLow="0" VerticalHigh="6"/>
<telerikCharting:ScatterRangeDataPoint HorizontalLow="40" HorizontalHigh="60" VerticalLow="0" VerticalHigh="5.5"/>
<telerikCharting:ScatterRangeDataPoint HorizontalLow="60" HorizontalHigh="65" VerticalLow="0" VerticalHigh="6"/>
<telerikCharting:ScatterRangeDataPoint HorizontalLow="65" HorizontalHigh="70" VerticalLow="0" VerticalHigh="7"/>
<telerikCharting:ScatterRangeDataPoint HorizontalLow="70" HorizontalHigh="110" VerticalLow="0" VerticalHigh="6.5"/>
</telerikChart:ScatterRangeBarSeries.DataPoints>
</telerikChart:ScatterRangeBarSeries>
</telerikChart:RadCartesianChart>
telerikChart namespace points to: xmlns:telerikChart="using:Telerik.UI.Xaml.Controls.Chart
The telerikCharting namespace points to: xmlns:telerikCharting="using:Telerik.Charting"
ScatterRangeBarSeries visual appearance
Data Binding
To bind the series to a collection of business objects, use its ItemsSource property. The series will create a new ScatterRangeDataPoint for each data item in the collection. To map the data item properties to the data point, use the HorizontalLowBinding, HorizontalHighBinding, VerticalLowBinding and VerticalHighBinding properties of the series.
Defining the data item model
public class ScatterBarInfo
{
    public double HorizontalLow { get; set; }
    public double HorizontalHigh { get; set; }
    public double VerticalLow { get; set; }
    public double VerticalHigh { get; set; }

    public ScatterBarInfo(double horizontalLow, double horizontalHigh, double verticalLow, double verticalHigh)
    {
        this.HorizontalLow = horizontalLow;
        this.HorizontalHigh = horizontalHigh;
        this.VerticalLow = verticalLow;
        this.VerticalHigh = verticalHigh;
    }
}
Populating with data
public MyUserControl()
{
InitializeComponent();
var source = new ObservableCollection<ScatterBarInfo>();
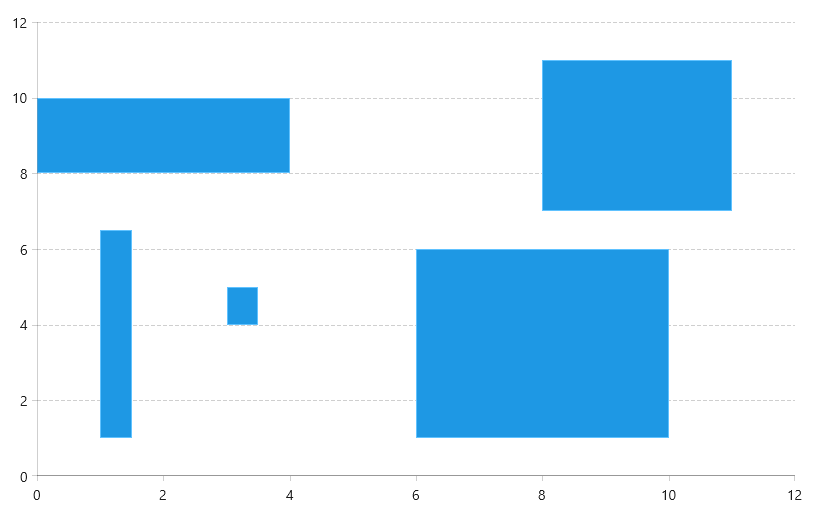
source.Add(new ScatterBarInfo(0, 4, 8, 10));
source.Add(new ScatterBarInfo(6, 10, 1, 6));
source.Add(new ScatterBarInfo(1, 1.5, 1, 6.5));
source.Add(new ScatterBarInfo(3, 3.5, 4, 5));
source.Add(new ScatterBarInfo(8, 11, 7, 11));
this.scatterRangeBarSeries.ItemsSource = source;
}
Specifying ScatterRangeBarSeries in XAML and setting its binding properties
<telerikChart:ScatterRangeBarSeries x:Name="scatterRangeBarSeries">
    <telerikChart:ScatterRangeBarSeries.HorizontalLowBinding>
        <telerikChart:PropertyNameDataPointBinding PropertyName="HorizontalLow"/>
    </telerikChart:ScatterRangeBarSeries.HorizontalLowBinding>
    <telerikChart:ScatterRangeBarSeries.HorizontalHighBinding>
        <telerikChart:PropertyNameDataPointBinding PropertyName="HorizontalHigh"/>
    </telerikChart:ScatterRangeBarSeries.HorizontalHighBinding>
    <telerikChart:ScatterRangeBarSeries.VerticalLowBinding>
        <telerikChart:PropertyNameDataPointBinding PropertyName="VerticalLow"/>
    </telerikChart:ScatterRangeBarSeries.VerticalLowBinding>
    <telerikChart:ScatterRangeBarSeries.VerticalHighBinding>
        <telerikChart:PropertyNameDataPointBinding PropertyName="VerticalHigh"/>
    </telerikChart:ScatterRangeBarSeries.VerticalHighBinding>
</telerikChart:ScatterRangeBarSeries>
ScatterRangeBarSeries populated with data binding
Palette Coloring
The chart provides a built-in palette support that allows you to automatically color each series or data point in a different color. То enable this, set the Palette property of the chart control. You can find more information about this feature in the Color Palette article.
To change the palette mode of ScatterRangeBarSeries, set its PaletteMode property. The available options are Series and DataPoint (default value). This determines if each data point in the same series should use a different color from the palette, or the entire series (all data points) should have the same color.
Customizing Bar Appearance
To customize the bar appearance set the DefaultVisualStyle property of the ScatterRangeBarSeries. The Styleshould target the Border element.
Setting the DefaultVisualStyle
<telerikChart:ScatterRangeBarSeries.DefaultVisualStyle>
    <Style TargetType="Border">
        <Setter Property="Background" Value="#B4FF8080"/>
        <Setter Property="BorderBrush" Value="Black"/>
        <Setter Property="BorderThickness" Value="1"/>
    </Style>
</telerikChart:ScatterRangeBarSeries.DefaultVisualStyle>