Scatter Bubble Series
The scatter bubble series is used to visualize three dimensional data. Each entity in the data set is represented by a bubble shape. Two of the data's dimensions determine the bubble's position and the third determines its size.
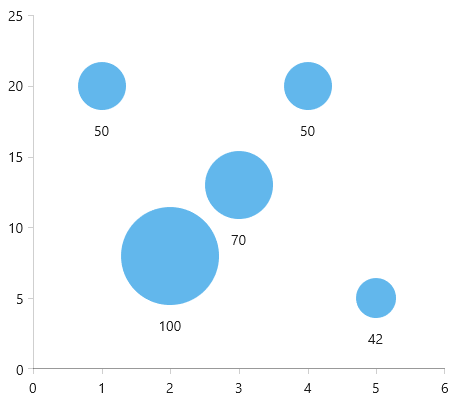
You can use the following definition to display a simple ScatterBubbleSeries.
<telerikChart:RadCartesianChart>
    <telerikChart:RadCartesianChart.HorizontalAxis>
        <telerikChart:LinearAxis />
    </telerikChart:RadCartesianChart.HorizontalAxis>
    <telerikChart:RadCartesianChart.VerticalAxis>
        <telerikChart:LinearAxis />
    </telerikChart:RadCartesianChart.VerticalAxis>
    <telerikChart:RadCartesianChart.Series>
        <telerikChart:ScatterBubbleSeries ShowLabels="True" >
            <telerikChart:ScatterBubbleSeries.DataPoints>
                <telerikCharting:ScatterBubbleDataPoint BubbleSize="50" XValue="1" YValue="20" />
                <telerikCharting:ScatterBubbleDataPoint BubbleSize="100" XValue="2" YValue="8" />
                <telerikCharting:ScatterBubbleDataPoint BubbleSize="70" XValue="3" YValue="13" />
                <telerikCharting:ScatterBubbleDataPoint BubbleSize="50" XValue="4" YValue="20" />
                <telerikCharting:ScatterBubbleDataPoint BubbleSize="42" XValue="5" YValue="5" />
            </telerikChart:ScatterBubbleSeries.DataPoints>
        </telerikChart:ScatterBubbleSeries>
    </telerikChart:RadCartesianChart.Series>
</telerikChart:RadCartesianChart>
xmlns:telerikChart="using:Telerik.UI.Xaml.Controls.Chart" and xmlns:telerikCharting="using:Telerik.Charting".
Data Binding
The ScatterBubbleSeries works with data point objects of type ScatterBubbleDataPoint. In a data binding scenario a ScatterBubbleDataPoint will be created for each data item in the ItemsSource collection of the series. To map the properties of the business objects from the ItemsSource to the properties of the data point object, use the binding properties of the series:
-
XValueBinding
-
YValueBinding
-
BubbleSizeBinding
The following example shows how to create a simple object describing a bubble and populate the series with a sample collection.
Defining the model
public class PlotInfo
{
    public double XVal { get; set; }
    public double YVal { get; set; }
    public double Size { get; set; }
}

//.......
this.scatterBubbleSeries.ItemsSource = new ObservableCollection<PlotInfo>
{
    new PlotInfo { XVal = 4, YVal = 20, Size = 50, },
    //....
};
Defining ScatterBubbleSeries in data binding scenario
<telerikChart:RadCartesianChart>
    <telerikChart:RadCartesianChart.HorizontalAxis>
        <telerikChart:LinearAxis />
    </telerikChart:RadCartesianChart.HorizontalAxis>
    <telerikChart:RadCartesianChart.VerticalAxis>
        <telerikChart:LinearAxis />
    </telerikChart:RadCartesianChart.VerticalAxis>
    <telerikChart:RadCartesianChart.Series>
        <telerikChart:ScatterBubbleSeries x:Name="scatterBubbleSeries" ShowLabels="True" >
            <telerikChart:ScatterBubbleSeries.XValueBinding>
                <telerikChart:PropertyNameDataPointBinding PropertyName="XVal" />
            </telerikChart:ScatterBubbleSeries.XValueBinding>
            <telerikChart:ScatterBubbleSeries.YValueBinding>
                <telerikChart:PropertyNameDataPointBinding PropertyName="YVal" />
            </telerikChart:ScatterBubbleSeries.YValueBinding>
            <telerikChart:ScatterBubbleSeries.BubbleSizeBinding>
                <telerikChart:PropertyNameDataPointBinding PropertyName="Size" />
            </telerikChart:ScatterBubbleSeries.BubbleSizeBinding>
        </telerikChart:ScatterBubbleSeries>
    </telerikChart:RadCartesianChart.Series>
</telerikChart:RadCartesianChart>
BubbleSizeSelector
The bubble size selector allows you to customize the size of each bubble. The ScatterBubbleSeries exposes a BubbleSizeSelector property that accepts a property of type ChartBubbleSizeSelector.
The size of the bubbles is always determined by the BubbleSizeSelector. By default the series uses the AbsoluteBubbleSizeSelector which returns the BubbleSize value of the data point. There are two built-in size selectors – the AbsoluteBubbleSizeSelector and the RelativeBubbleSizeSelector. The absolute selector is simple and it always returns the BubbleSize value. If your business items contain the size in pixels, you can use the default selector.
On the other hand the relative size selector is more complex and it takes into account several factors when calculating the bubble size. The selector chooses a size that is relative to the maximum value in the associated series and the maximum allowed size. The maximum size of a bubble depends on the size of the chart and the MaximumSizePercent property of the selector. By default the value of this property set to 0.2 and the maximum bubble size is 20% of the chart's size. You can adjust the RelativeBubbleSizeSelector by manually setting its MinimumValue, MaximumValue, MinimumSize, MaximumSize. You can use the BubbleSizeFunction property to specify whether how the value should be mapped - with a linear function, square root function, logarithmic function or a cubic function.
Create Custom BubbleSizeSelector
You can customize the BubbleSize of each BubbleDataPoint by creating a custom bubble size selector. The selector should derive from the abstract ChartBubbleSizeSelector class which exposes a single abstract method called SelectBubbleSize. The method accepts an object of type IBubbleDataPoint and it returns the size of the bubble. You can calculate the new size based on the information in the data point object.
The following code snippet demonstrates an example implementation of a bubble size selector:
Creating custom selector
public class CustomBubbleSizeSelector : ChartBubbleSizeSelector
{
    public static double SelectBubbleSize(double bubbleSize)
    {
        return Math.Abs(bubbleSize) / 1000;
    }

    public override RadSize SelectBubbleSize(IBubbleDataPoint dataPoint)
    {
        double size = SelectBubbleSize(dataPoint.BubbleSize.Value);
        return new RadSize(size, size);
    }
}
Using the custom bubble size selector
<Use.Resources>
    <local:CustomBubbleSizeSelector x:Key="CustomBubbleSizeSelector" />
</FrameworkElement.Resources>
..........
<telerikChart:ScatterBubbleSeries BubbleSizeSelector="{StaticResource selector}" />