Range Series
With a RangeSeries the high data points as well as the low data points are connected with straight line segments and the area enclosed by the two lines may be optionally stroked and/or filled.
Properties
RangeSeries class inherits from the RangeSeriesBase class - See the inherited properties.
- Fill: Gets or sets the Brush instance that defines the fill of series.
- Stroke: Gets or sets the Brush instance that defines the stroke of the series.
- StrokeThickness: Gets or sets the thickness of the line used to present the series.
- StrokeMode: Gets or sets the mode that defines how the area is stroked.
- StrokeLineJoin: Gets or sets a PenLineJoin enumeration value that specifies the type of join that is used at the vertices of a stroked series.
Example
Example 1 shows how to create a RadCartesianChart with a Range Series.
Example 1: Defining a RadCartesianChart with a RangeSeries
<Grid xmlns:telerikChart="using:Telerik.UI.Xaml.Controls.Chart"
xmlns:telerikCharting="using:Telerik.Charting">
<telerikChart:RadCartesianChart>
<telerikChart:RadCartesianChart.HorizontalAxis>
<telerikChart:CategoricalAxis/>
</telerikChart:RadCartesianChart.HorizontalAxis>
<telerikChart:RadCartesianChart.VerticalAxis>
<telerikChart:LinearAxis/>
</telerikChart:RadCartesianChart.VerticalAxis>
<telerikChart:RangeSeries>
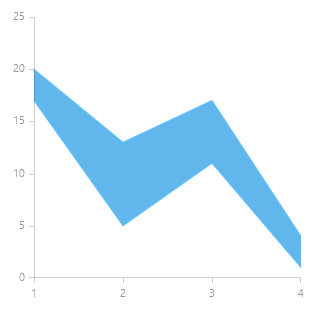
<telerikCharting:RangeDataPoint Category="1" High="20" Low="17" />
<telerikCharting:RangeDataPoint Category="2" High="13" Low="5" />
<telerikCharting:RangeDataPoint Category="3" High="17" Low="11" />
<telerikCharting:RangeDataPoint Category="4" High="4" Low="1" />
</telerikChart:RangeSeries>
</telerikChart:RadCartesianChart>
</Grid>
Figure 1: Result from Example 1