RangeBar Series
Data points are represented by a box where the height (width) of the box is the distance between the point’s high value and the point's low value. Bars may be either horizontal or vertical depending on whether the categorical axis is specified as an X-axis or as an Y-axis.
Properties
RangeBarSeries class inherits from the RangeSeriesBase class - See the inherited properties.
- CombineMode: Gets or sets the combination mode to be used when data points are plotted. The RangeBarSeries supports only a Cluster CombineMode.
-
PaletteMode: Gets or sets whether the chart palette will be applied on a per series or per datapoint basis. The available values are:
- Series: Applies the palette on a per series basis.
- DataPoint: Applies the palette on a per point basis.
- LegendTitleBinding: Gets or sets the binding that will be used by any attached legend to display a legend item title.
Example
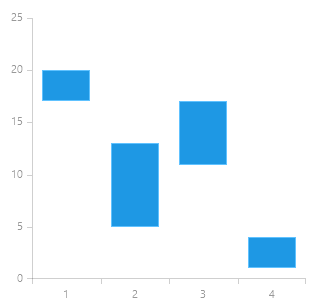
Example 1 shows how to create a RadCartesianChart with a RangeBar Series.
Example 1: Defining a RadCartesianChart with a RangeBarSeries
<Grid xmlns:telerikChart="using:Telerik.UI.Xaml.Controls.Chart"
      xmlns:telerikCharting="using:Telerik.Charting">
    <telerikChart:RadCartesianChart>
        <telerikChart:RadCartesianChart.HorizontalAxis>
            <telerikChart:CategoricalAxis/>
        </telerikChart:RadCartesianChart.HorizontalAxis>
        <telerikChart:RadCartesianChart.VerticalAxis>
            <telerikChart:LinearAxis/>
        </telerikChart:RadCartesianChart.VerticalAxis>

        <telerikChart:RangeBarSeries>
            <telerikCharting:RangeDataPoint Category="1" High="20" Low="17" />
            <telerikCharting:RangeDataPoint Category="2" High="13" Low="5" />
            <telerikCharting:RangeDataPoint Category="3" High="17" Low="11" />
            <telerikCharting:RangeDataPoint Category="4" High="4" Low="1" />
        </telerikChart:RangeBarSeries>
    </telerikChart:RadCartesianChart>
</Grid>
Figure 1: Result from Example 1