TrackBall Behavior
The ChartTrackBallBehavior can display a vertical line across the chart plot area and also display visual indicators (rectangle by default) at points where the trackball line crosses the visualization of a series object.
Properties
There are the properties exposed by the ChartTrackBallBehavior:
- ShowInfo (bool): Determines whether the visual information for all the closest data points will be displayed.
- ShowIntersectionPoints (bool): Determines whether a visual representation for all the intersection points will be displayed.
-
SnapMode (TrackBallSnapMode): Gets or sets how this behavior should snap to the closest physical location data points.
- None: The trackball will not be snapped to any of the closest data points.
- ClosestPoint: The behavior will snap to the closest data point, regardless of the chart series that owns it.
- AllClosePoints: The behavior will snap to the closest data points from all chart series.
-
InfoMode (TrackInfoMode): Gets or sets a value indicating whether the track information will be displayed for the whole series or individual data points.
- Multiple: Each series information is displayed in a box on top of the plot area.
- Individual: A tooltip-like box is displayed next to each intersection data point.
- TrackInfoTemplate (attached property): Specifies the DataTemplate for the displayed information on a per series/indicator basis. This property has to be attached to a chart series/indicator.
- IntersectionTemplate (attached property): Specifies the DataTemplate for the intersection point on a per series/indicator basis. This property has to be attached to a chart series/indicator.
- LineStyle (Style): Gets or sets the Style that defines the appearance of the vertical line that marks the position of the trackball. The Style should target the Polyline type.
- InfoStyle: Gets or sets the Style that defines the appearance of the TrackInfo control displayed by a ChartTrackBallBehavior instance. The Style should target the TrackBallInfoControl type defined in the Telerik.UI.Xaml.Controls.Chart.Primitives namespace. >The InfoStyle property affects the Style of the TrackBallInfoControl only when the ChartTrackBallBehavior.InfoMode isMultiple.
Example 1: Declaring a ChartTrackBallBehavior
<telerikChart:RadCartesianChart.Behaviors>
    <telerikChart:ChartTrackBallBehavior  InfoMode="Multiple"/>
</telerikChart:RadCartesianChart.Behaviors>
Customization Example
This example will demonstrate how you can completely customize the TrackBallInfoBehavior by displaying custom information about the data item, changing the style of the information box, changing the style of the line and changing the template of the intersection point with the series line.
Example 2: Defining the Model
public class Data
{
    public double Value { get; set; }

    public string Category { get; set; }

    public string Info { get; set; }
}
Example 3: Declaring the RadCartesianChart in xaml
<Grid xmlns:telerikChart="using:Telerik.UI.Xaml.Controls.Chart"
      xmlns:telerikCharting="using:Telerik.Charting"
      xmlns:telerikChartPrimitives="using:Telerik.UI.Xaml.Controls.Chart.Primitives">
    <telerikChart:RadCartesianChart x:Name="chart" Width="300" Height="250">
        <telerikChart:RadCartesianChart.HorizontalAxis>
            <telerikChart:CategoricalAxis PlotMode="OnTicksPadded"/>
        </telerikChart:RadCartesianChart.HorizontalAxis>
        <telerikChart:RadCartesianChart.VerticalAxis>
            <telerikChart:LinearAxis/>
        </telerikChart:RadCartesianChart.VerticalAxis>

        <telerikChart:LineSeries>
            <telerikChart:LineSeries.CategoryBinding>
                <telerikChart:PropertyNameDataPointBinding PropertyName="Category"/>
            </telerikChart:LineSeries.CategoryBinding>
            <telerikChart:LineSeries.ValueBinding>
                <telerikChart:PropertyNameDataPointBinding PropertyName="Value"/>
            </telerikChart:LineSeries.ValueBinding>

            <telerikChart:ChartTrackBallBehavior.TrackInfoTemplate>
                <DataTemplate>
                    <StackPanel>
                        <TextBlock Text="{Binding DataPoint.DataItem.Info}" Margin="5" Foreground="DarkSalmon"/>
                    </StackPanel>
                </DataTemplate>
            </telerikChart:ChartTrackBallBehavior.TrackInfoTemplate>

            <telerikChart:ChartTrackBallBehavior.IntersectionTemplate>
                <DataTemplate>
                    <Ellipse Width="10" Height="10" Fill="Tomato"/>
                </DataTemplate>
            </telerikChart:ChartTrackBallBehavior.IntersectionTemplate>

        </telerikChart:LineSeries>

        <telerikChart:RadCartesianChart.Behaviors>
            <telerikChart:ChartTrackBallBehavior InfoMode="Multiple" ShowIntersectionPoints="True">

                <telerikChart:ChartTrackBallBehavior.LineStyle>
                    <Style TargetType="Polyline">
                        <Setter Property="Stroke" Value="Tomato"/>
                        <Setter Property="StrokeThickness" Value="2"/>
                        <Setter Property="StrokeDashArray" Value="1,2"/>
                    </Style>
                </telerikChart:ChartTrackBallBehavior.LineStyle>

                <telerikChart:ChartTrackBallBehavior.InfoStyle>
                    <Style TargetType="telerikChartPrimitives:TrackBallInfoControl">
                        <Setter Property="Background" Value="White"/>
                    </Style>
                </telerikChart:ChartTrackBallBehavior.InfoStyle>

            </telerikChart:ChartTrackBallBehavior>
        </telerikChart:RadCartesianChart.Behaviors>
    </telerikChart:RadCartesianChart>
</Grid>
You can see that in the TrackInfoTemplate we can access the DataPoint and the underlying DataItem as well.
Example 4: Populating the ItemsSource
chart.Series[0].ItemsSource = new ObservableCollection<Data>
{
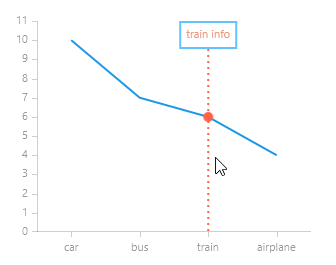
new Data { Value = 10, Category = "car", Info = "car info" },
new Data { Value = 7, Category = "bus", Info = "bus info" },
new Data { Value = 6, Category = "train", Info = "train info" },
new Data { Value = 4, Category = "airplane", Info = "airplane info" }
};
Figure 1: RadCartesianChart with ChartTrackBallBehavior