ToolTip Behavior
RadChart provides a tool tip behavior that can be used to visualize information related to a data point. If the user holds down the mouse directly over a data point, the tooltip will display information for this particular data point, otherwise it will display information for the closest data point to the hold location.
The DataContext of ChartTooltipBehavior consists of objects of type DataPointInfo.
Properties
- ContentTemplate (DataTemplate): This is an attached property used by chart series to define different tooltips on a per series basis.
- ShowDelay (TimeSpan): Gets or sets the delay to be applied before the tooltip is displayed.
- VerticalAlignment: Gets or sets the alignment of the tooltip according to the touch point along the vertical axis.
- HorizontalAlignment: Gets or sets the alignment of the tooltip according to the touch point along the horizontal axis.
- SnapToClosestPoint (bool): Determines whether the tooltip will snap to the location of the closest data point.
- IsOpen (bool): Determines whether the tooltip is currently displayed.
Declaration
Example 1 shows how to add a ChartTooltipBehavior to the Behaviors collection.
Example 1: Inverse axes in RadCartesianChart
<telerikChart:RadCartesianChart.Behaviors>
    <telerikChart:ChartTooltipBehavior/>
</telerikChart:RadCartesianChart.Behaviors>
Example
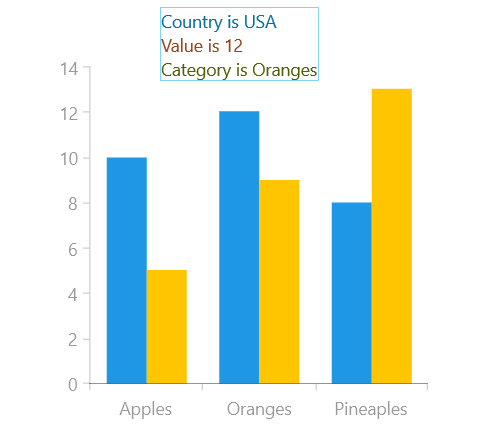
Examples 2, 3 and 4 show how to use the ChartTooltipBehavior with two BarSeries. We will demonstrate how to define behavior on a per chart and per series basis. Additionally, this example uses a custom Converter to format the content of the tooltip template.
Example 2: Model and ViewModel
public class Data
{
    public string Category { get; set; }

    public double Value { get; set; }

    public double SecondValue { get; set; }

    public string Country { get; set; }

    public string SecondCountry { get; set; }
}

public class ViewModel
{
    public ViewModel()
    {
        this.Data = this.GetData();
    }

    public List<Data> Data { get; set; }

    private List<Data> GetData()
    {
        List<Data> data = new List<Data>();
        data.Add(new Data() { Category = "Apples", Value = 10, SecondValue = 5, Country = "Bulgaria", SecondCountry = "Italy" });
        data.Add(new Data() { Category = "Oranges", Value = 12, SecondValue = 9, Country = "Brazil", SecondCountry = "USA" });
        data.Add(new Data() { Category = "Pineaples", Value = 8, SecondValue = 13, Country = "Philippines", SecondCountry = "Brazil" });

        return data;
    }
}
Example 3: RadCartesianChart with ChartTooltipBehavior
<Grid xmlns:telerikChart="using:Telerik.UI.Xaml.Controls.Chart"
      xmlns:telerikCharting="using:Telerik.Charting">
    <telerikChart:RadCartesianChart PaletteName="DefaultDark" x:Name="chart" Width="700" Height="700">
        <telerikChart:RadCartesianChart.DataContext>
            <local:ViewModel/>
        </telerikChart:RadCartesianChart.DataContext>
        <telerikChart:RadCartesianChart.Resources>
            <local:CustomConverter x:Key="Converter"/>
        </telerikChart:RadCartesianChart.Resources>
        <telerikChart:RadCartesianChart.Behaviors>
            <telerikChart:ChartTooltipBehavior>
                <telerikChart:ChartTooltipBehavior.ContentTemplate>
                    <DataTemplate>
                        <Border BorderBrush="#80D6F4" BorderThickness="1">
                            <StackPanel Background="White">
                                <TextBlock Text="{Binding DataPoint.DataItem.SecondCountry, Converter={StaticResource Converter}, ConverterParameter=Country}" Foreground="#076FA0" />
                                <TextBlock Text="{Binding DataPoint.Value, Converter={StaticResource Converter}, ConverterParameter=Value}" Foreground="#99441D"/>
                                <TextBlock Text="{Binding DataPoint.Category, Converter={StaticResource Converter},ConverterParameter=Category}" Foreground="#506005"/>
                            </StackPanel>
                        </Border>
                    </DataTemplate>
                </telerikChart:ChartTooltipBehavior.ContentTemplate>
            </telerikChart:ChartTooltipBehavior>
        </telerikChart:RadCartesianChart.Behaviors>
        <telerikChart:RadCartesianChart.VerticalAxis>
            <telerikChart:LinearAxis/>
        </telerikChart:RadCartesianChart.VerticalAxis>
        <telerikChart:RadCartesianChart.HorizontalAxis>
            <telerikChart:CategoricalAxis/>
        </telerikChart:RadCartesianChart.HorizontalAxis>

        <telerikChart:BarSeries ItemsSource="{Binding Data}">
            <telerikChart:BarSeries.CategoryBinding>
                <telerikChart:PropertyNameDataPointBinding PropertyName="Category"/>
            </telerikChart:BarSeries.CategoryBinding>
            <telerikChart:BarSeries.ValueBinding>
                <telerikChart:PropertyNameDataPointBinding PropertyName="Value"/>
            </telerikChart:BarSeries.ValueBinding>
        </telerikChart:BarSeries>

        <telerikChart:BarSeries ItemsSource="{Binding Data}" >
            <telerikChart:ChartTooltipBehavior.ContentTemplate>
                <DataTemplate>
                    <Border BorderThickness="1" BorderBrush="Orange">
                        <StackPanel>
                            <TextBlock Text="{Binding DataPoint.DataItem.SecondCountry}" Foreground="Orange"/>
                            <TextBlock Text="{Binding DataPoint.Value}" Foreground="Orange" HorizontalAlignment="Center" VerticalAlignment="Center"/>
                        </StackPanel>
                    </Border>
                </DataTemplate>
            </telerikChart:ChartTooltipBehavior.ContentTemplate>
            <telerikChart:BarSeries.CategoryBinding>
                <telerikChart:PropertyNameDataPointBinding PropertyName="Category"/>
            </telerikChart:BarSeries.CategoryBinding>
            <telerikChart:BarSeries.ValueBinding>
                <telerikChart:PropertyNameDataPointBinding PropertyName="SecondValue"/>
            </telerikChart:BarSeries.ValueBinding>
        </telerikChart:BarSeries>
    </telerikChart:RadCartesianChart>
</Grid>
Example 4: CustomConverter implementation
public class CustomConverter : IValueConverter
{
    public object Convert(object value, Type targetType, object parameter, string language)
    {
        return string.Format("{0} is {1}", parameter, value);
    }

    public object ConvertBack(object value, Type targetType, object parameter, string language)
    {
        throw new NotImplementedException();
    }
}
Figure 1: BarSeries with custom tooltip