Adding Different Colors to the Bars of the Chart
Environment
| Product | Progress® Telerik® UI for .NET MAUI Chart |
| Product Version | 2.0.0 |
Description
How can I add a palette to the Telerik UI for .NET MAUI Bar Chart to show each bar in a different color?
Solution
To implement a Chart palette, add a Palette entry in XAML. In general, you have to create a custom Chart palette in the ViewModel.
The suggested approach uses the code from the Telerik UI for .NET MAUI documentation for the Chart Bar Series and adds the necessary components to achieve the desired result.
To achieve the desired scenario:
1. Add the Color property to the business model:
public class DataItem
    {
        public string Category { get; set; }
        public double? Value { get; set; }
        public Color barColor { get; set; }
    }
2. In the Collection, set values for the barColor property of type Color:
var seriesData = new ObservableCollection<DataItem>()
{
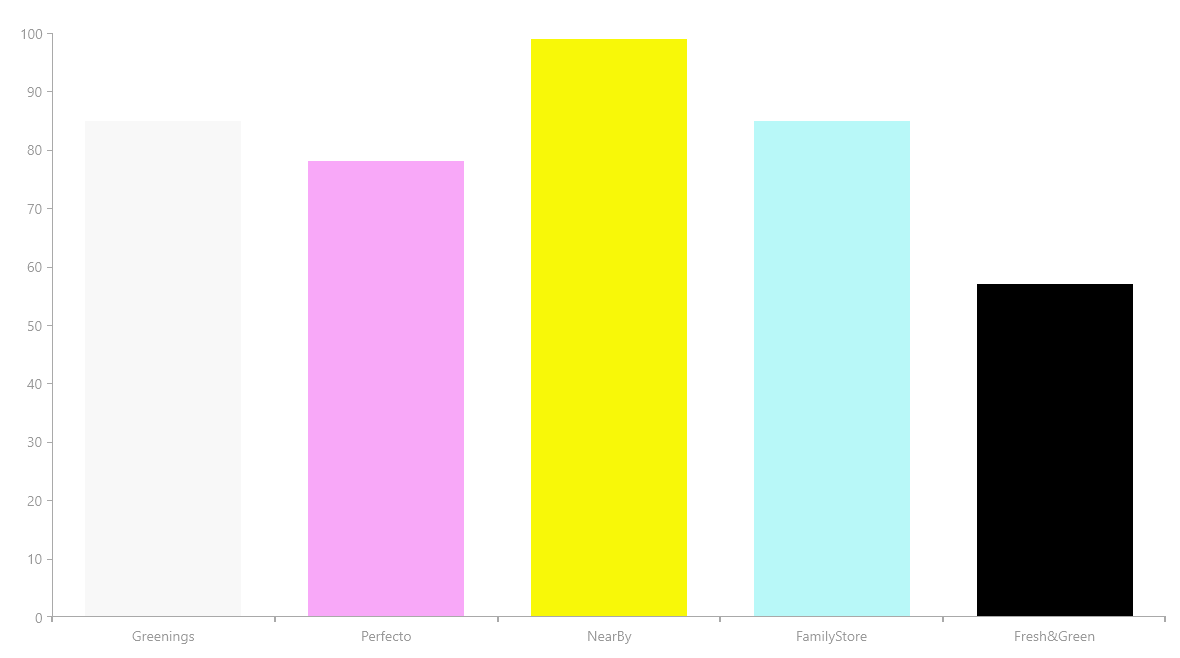
new DataItem(){Category = "Greenings", Value = 85, barColor = Color.FromRgba("#F8F8F8")},
new DataItem(){Category = "Perfecto", Value = 78, barColor = Color.FromRgba("#F8A8F8")},
new DataItem(){Category = "NearBy", Value = 99, barColor = Color.FromRgba("#F8F808")},
new DataItem(){Category = "FamilyStore", Value = 85, barColor = Color.FromRgba("#B8F8F8")},
new DataItem(){Category = "Fresh&Green", Value = 57, barColor = Color.FromRgba("#000000")}
};
3. After creating the business model and the collection of data, create a class in the ViewModel that changes the values of the Chart Palette.
4. Create a Bindable property to store the Colors:
public static readonly BindableProperty ColorsSourceProperty = BindableProperty.CreateAttached("ColorsSource", typeof(IEnumerable), typeof(ChartUtils), null, propertyChanged: OnColorsSourceChanged);
5. Define the properties which get and set the values in the collection:
public static IEnumerable GetColorsSource(BindableObject bindableObject)
        {
            return (IEnumerable)bindableObject.GetValue(ColorsSourceProperty);
        }

public static void SetColorsSource(BindableObject bindableObject, IEnumerable value)
        {
            bindableObject.SetValue(ColorsSourceProperty, value);
        }
6. To get the desired color, add a method which changes the old palette to a new one:
private static void OnColorsSourceChanged(BindableObject bindable, object oldValue, object newValue)
        {
            IEnumerable newColorsSource = (IEnumerable)newValue;
            RadCartesianChart chart = (RadCartesianChart)bindable;
            chart.Palette = ToChartPalette(newColorsSource);
        }
7. After having the OnColorsSourceChanged method, you need another one which will create the new palette entries based on the data from SeriesData collection:
private static ChartPalette ToChartPalette(IEnumerable colorsSource)
        {
            ChartPalette chartPalette = new ChartPalette();

            if (colorsSource != null)
            {
                foreach (var item in colorsSource)
                {
                    if (item is DataItem dataItem)
                    {
                        PaletteEntry entry = new PaletteEntry();
                        entry.FillColor = dataItem.barColor;
                        entry.StrokeColor = dataItem.barColor;
                        chartPalette.Entries.Add(entry);
                    }
                }
            }

            return chartPalette;
        }
8. Add the following code.
public static class ChartUtils
    {
        public static readonly BindableProperty ColorsSourceProperty = BindableProperty.CreateAttached("ColorsSource", typeof(IEnumerable), typeof(ChartUtils), null,
            propertyChanged: OnColorsSourceChanged);

        public static IEnumerable GetColorsSource(BindableObject bindableObject)
        {
            return (IEnumerable)bindableObject.GetValue(ColorsSourceProperty);
        }

        public static void SetColorsSource(BindableObject bindableObject, IEnumerable value)
        {
            bindableObject.SetValue(ColorsSourceProperty, value);
        }

        private static void OnColorsSourceChanged(BindableObject bindable, object oldValue, object newValue)
        {
            IEnumerable newColorsSource = (IEnumerable)newValue;
            RadCartesianChart chart = (RadCartesianChart)bindable;
            chart.Palette = ToChartPalette(newColorsSource);
        }

        private static ChartPalette ToChartPalette(IEnumerable colorsSource)
        {
            ChartPalette chartPalette = new ChartPalette();

            if (colorsSource != null)
            {
                foreach (var item in colorsSource)
                {
                    if (item is DataItem dataItem)
                    {
                        PaletteEntry entry = new PaletteEntry();
                        entry.FillColor = dataItem.barColor;
                        entry.StrokeColor = dataItem.barColor;
                        chartPalette.Entries.Add(entry);
                    }
                }
            }

            return chartPalette;
        }
    }
9. Attach the ChartUtils class to the Chart in XAML.
Set the
PaletteModetoDataPointproperties. Otherwise, the palettes will fail to apply to the Chart.
<telerik:RadCartesianChart chartPalettes:ChartUtils.ColorsSource="{Binding SeriesData}">
    <telerik:RadCartesianChart.ChartBehaviors>
        <telerik:ChartSelectionBehavior DataPointSelectionMode="Single"
                                                SeriesSelectionMode="None" />
    </telerik:RadCartesianChart.ChartBehaviors>
    <telerik:RadCartesianChart.HorizontalAxis>
        <telerik:CategoricalAxis LineColor="#A9A9A9"
                                        MajorTickThickness="2"
                                        PlotMode="BetweenTicks"
                                        LabelFitMode="MultiLine"
                                        ShowLabels="True"
                                        MajorTickBackgroundColor="#A9A9A9" />
    </telerik:RadCartesianChart.HorizontalAxis>
    <telerik:RadCartesianChart.VerticalAxis>
        <telerik:NumericalAxis LineColor="#A9A9A9"
                                    MajorTickBackgroundColor="#A9A9A9"
                                    Minimum="0" />
    </telerik:RadCartesianChart.VerticalAxis>
    <telerik:RadCartesianChart.Grid>
        <telerik:CartesianChartGrid MajorLinesVisibility="Y"
                                            MajorLineThickness="1" />
    </telerik:RadCartesianChart.Grid>
    <telerik:RadCartesianChart.Series>
        <telerik:BarSeries CategoryBinding="Category"
                            ValueBinding="Value"
                            PaletteMode="DataPoint"
                            ItemsSource="{Binding SeriesData}" />
    </telerik:RadCartesianChart.Series>
</telerik:RadCartesianChart>
The following image shows the end result of the suggested implementation.