.NET MAUI Chart Area Series
The Cartesian Chart visualizes the Area Series as an area on the chart that is enclosed by the coordinate axes and straight line segments that connect the data points represented by these series. The Area Series extend the Categorical Stroked Series, so they are also Categorical Series and require one Categorical Axis and one Numerical Axis.
Features
The Area Series supports the following properties:
-
Fill—Defines the fill of the Area Series. -
Stroke—Changes the color for drawing lines. -
StrokeThickness—Changes the width of the lines.
Area Series Example
The following example shows how to create a Cartesian Chart with an Area Series:
1. Create the a sample business object:
public class CategoricalData
{
    public object Category { get; set; }
    public double Value { get; set; }
}
2. Create a ViewModel:
public class CategoricalViewModel
{
    public ObservableCollection<CategoricalData> Data { get; set; }

    public CategoricalViewModel()
    {
        this.Data = GetCategoricalData();
    }

    private static ObservableCollection<CategoricalData> GetCategoricalData()
    {
        var data = new ObservableCollection<CategoricalData>
        {
            new CategoricalData { Category = "Greenings", Value = 52 },
            new CategoricalData { Category = "Perfecto", Value = 19 },
            new CategoricalData { Category = "NearBy", Value = 82 },
            new CategoricalData { Category = "Family", Value = 23 },
            new CategoricalData { Category = "Fresh", Value = 56 },
        };
        return data;
    }
}
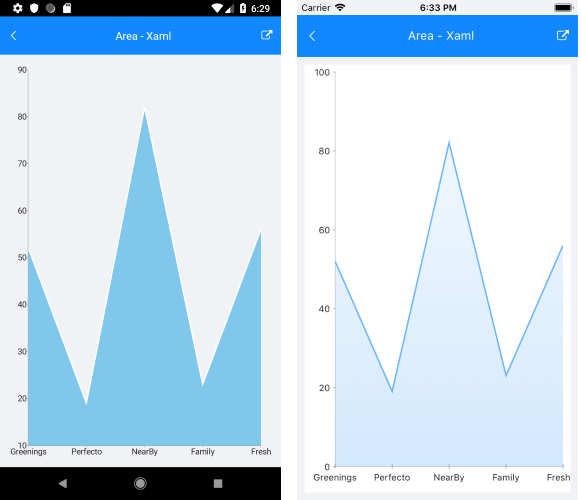
3. Use the following snippet to declare a Cartesian Chart with an Area Series in XAML and in C#:
<telerik:RadCartesianChart>
    <telerik:RadCartesianChart.BindingContext>
        <local:CategoricalViewModel />
    </telerik:RadCartesianChart.BindingContext>
    <telerik:RadCartesianChart.HorizontalAxis>
        <telerik:CategoricalAxis LabelFitMode="MultiLine"
                              PlotMode="OnTicks" />
    </telerik:RadCartesianChart.HorizontalAxis>
    <telerik:RadCartesianChart.VerticalAxis>
        <telerik:NumericalAxis />
    </telerik:RadCartesianChart.VerticalAxis>
    <telerik:RadCartesianChart.Series>
        <telerik:AreaSeries ValueBinding="Value"
                         CategoryBinding="Category"
                         ItemsSource="{Binding Data}" />
    </telerik:RadCartesianChart.Series>
</telerik:RadCartesianChart>
The following image shows the end result:
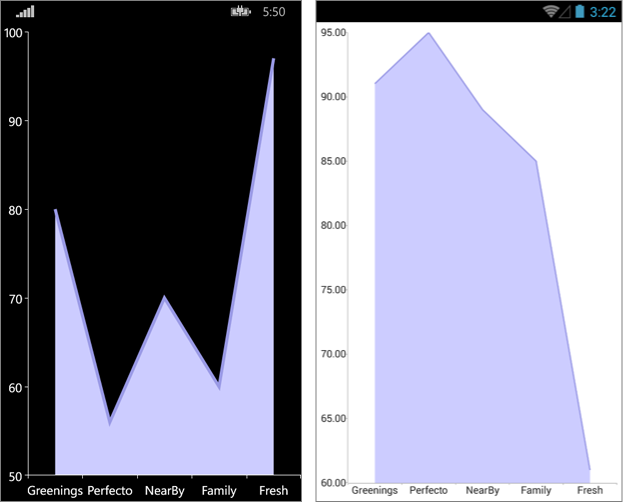
Customization Example
You can further customize the Area Series:
var series = new AreaSeries
{
    Fill = new Color(0.8, 0.8, 1),
    Stroke = new Color(0.6, 0.6, 0.9),
    StrokeThickness = 5
};
The following image shows the final result: