Analyze Load Results
Test Studio load tests can generate a large amount of data. This document contains suggestions to help you interpret this data. Keep in mind that the behavior of your application may be complex, and that each application is different. Work with the developers of your application, server administrators, and other stakeholders to gain insights specific to your environment.
Identify Key Areas of Load Data
Three sets of results data that your load test produces are usually important for the purposes of results analysis.
User Experience Metrics
These data directly measure the behavior of the application from the perspective of the end user. This category includes metrics like Average Response Time, HTTP Errors/second, and Responses Received/second. These metrics are gathered by Test Studio Load Tests by default, and do not require you to profile Performance Counters.
Load Generation Metrics
These data measure the amount of traffic that your test sends to the application under test. This category includes metrics like Created Virtual Users, Current Virtual Users, and Requests Sent/second. These metrics are gathered by Test Studio Load Tests by default, and do not require you to profile Performance Counters.
Resource Use Metrics
These data measure the amount of hardware resources the application under test uses during your load test. This category includes metrics like % Processor Time, Memory Cache Faults/sec, and Avg. Disk Queue Length. These metrics are not gathered by Test Studio Load Tests by default, and require you to profile Performance Counters.
Your test may measure additional metrics, but these are a good place to start your analysis.
Correlate Key Load Data
Once you have gathered and identified the key areas of load test data, you can ask questions about how these data relate to one another. For example:
What much system resources does the application utilize at peak traffic?
How does system resource usage affect user experience?
How does load generation affect user experience?
Are responses slower as the load test progresses?
Do more errors occur as the load test progresses?
At what point does user experience fail to meet the application requirements?
You can help identify whether your application meets its requirements or goals using the Goals feature.
Identify Issues
You can identify numerous problems by asking these questions. Most of these issues fall into one or more of the following categories.
Stress Sensitivity Points. These are points in the load test where user experience or resource usage changes abruptly or at an increased rate.
Slow resources. These are specific pages or requests that take a long time but don't impact the performance of other resources.
Bottlenecks. These are issues that hurt performance across multiple users and resources.
Bugs. These are issues that are not responsive to load.
Compare Key Load Data Graphically
Comparing any of the three key areas of load data to one another can help answer your questions about how these data relate to one another. Here are some common graphs to view:
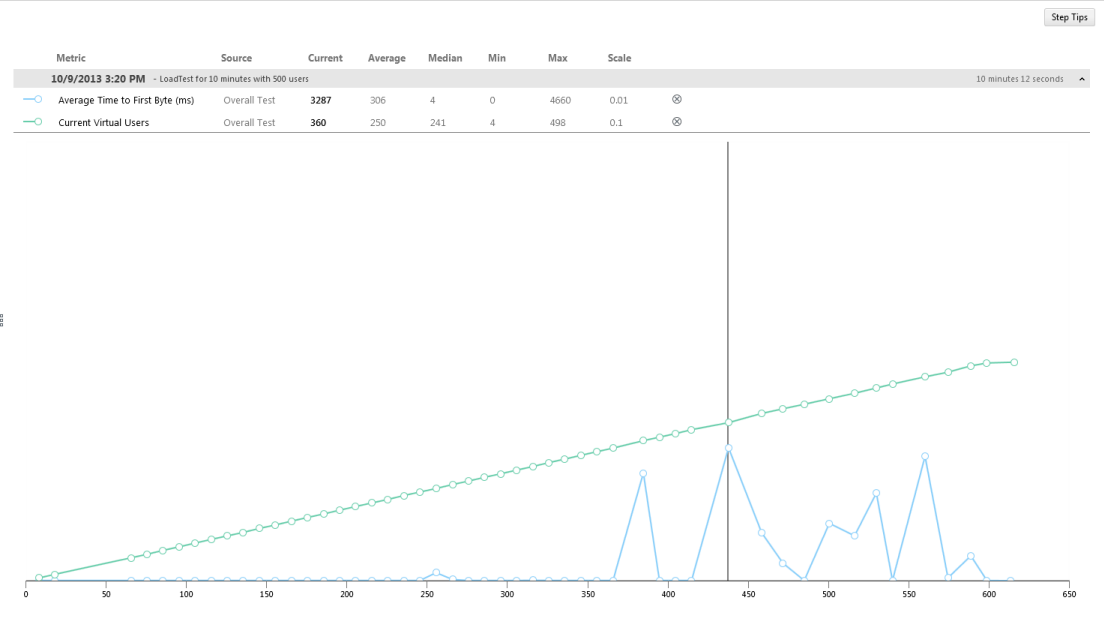
- Current Virtual Users vs. Average Time to First Byte. This graph shows how increasing load affects the time users wait to see the first new data on the page.
Average Time to First Byte may increase abruptly with added Virtual Users:

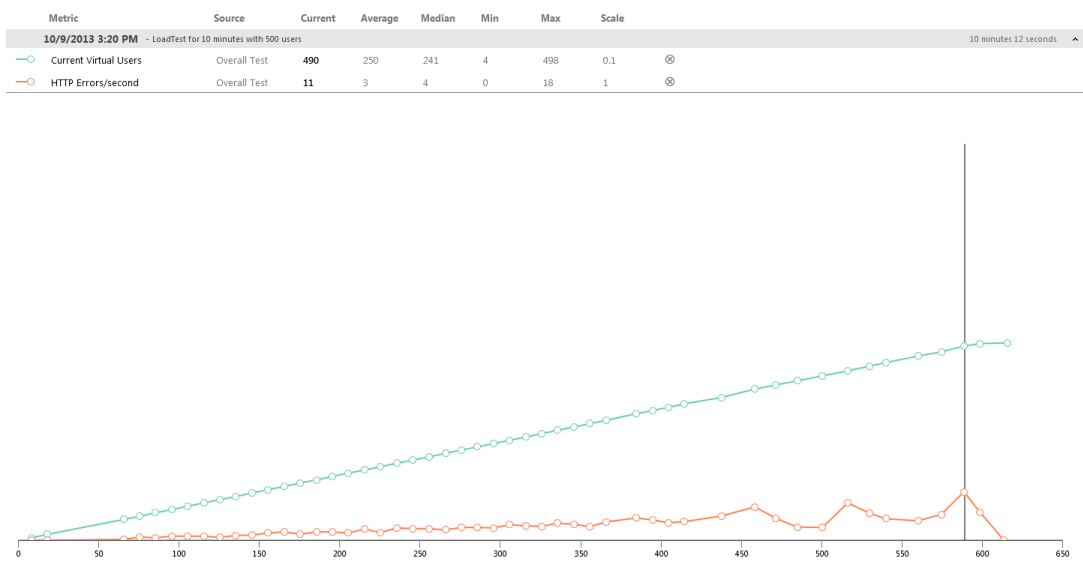
- Current Virtual users vs. HTTP Errors/second. This graph shows how increasing load affects the rate of HTTP errors received from the application server (See Figure 2). To find out more about which pages generate which errors, view Page Specific Metrics.
HTTP Errors/second may increase with added Virtual Users, or abruptly decrease if the server stops responding:

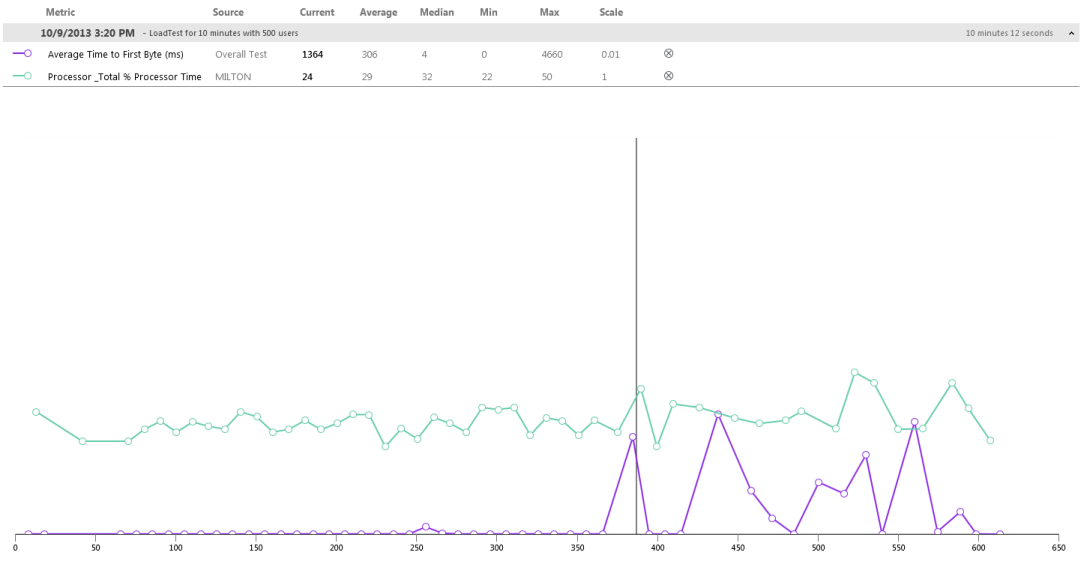
- Average Time to First Byte (ms) vs. Total % Processor Time. This graph shows how increasing processor use affects response times.
Spikes in processor usage may be associated with increased response times for users.

View Page Specific Metrics
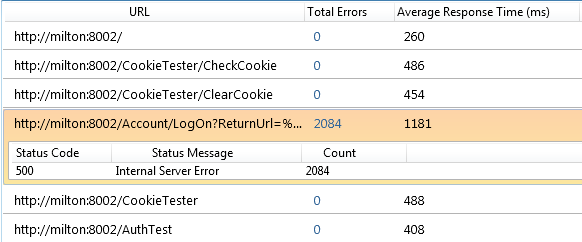
To identify slow resources and the cause of HTTP errors, view the Page Specific Metrics screen for your load results. This view helps identify which pages generated the most HTTP errors and which pages had the highest average response time.
A small number of pages may cause the majority of response time and HTTP errors. Errors are often associated with an increase in response time:

To find out what kind of errors a page generated, click on the row for that URL in the Page Specific Metrics view.
500 errors may indicate that the server is not configured correctly:
