Analyzing Results
During your test runs you’ll be shown clear, informative screens letting you know the state of your system throughout the run. You’re able to focus in on exactly the metrics you’re interested in, such as total errors, traffic size, time to first byte, and other common metrics.
Monitor Load Test Results During the Test Run
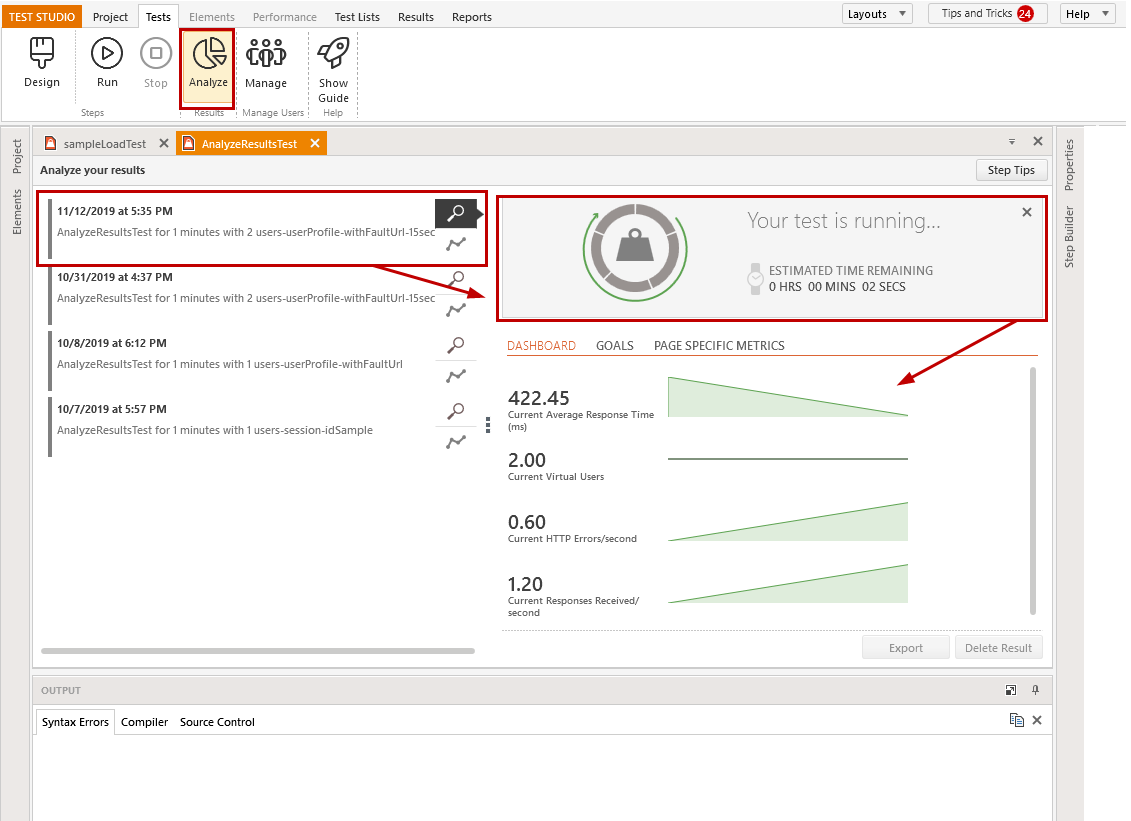
Once a load test run is started, the Run load test pane is switched to the Analyze view and allows you to monitor the collected metrics live during the test execution. The first data to appear is from the first sampling rate interval. Then, these get updated on each next sampling rate tick time.
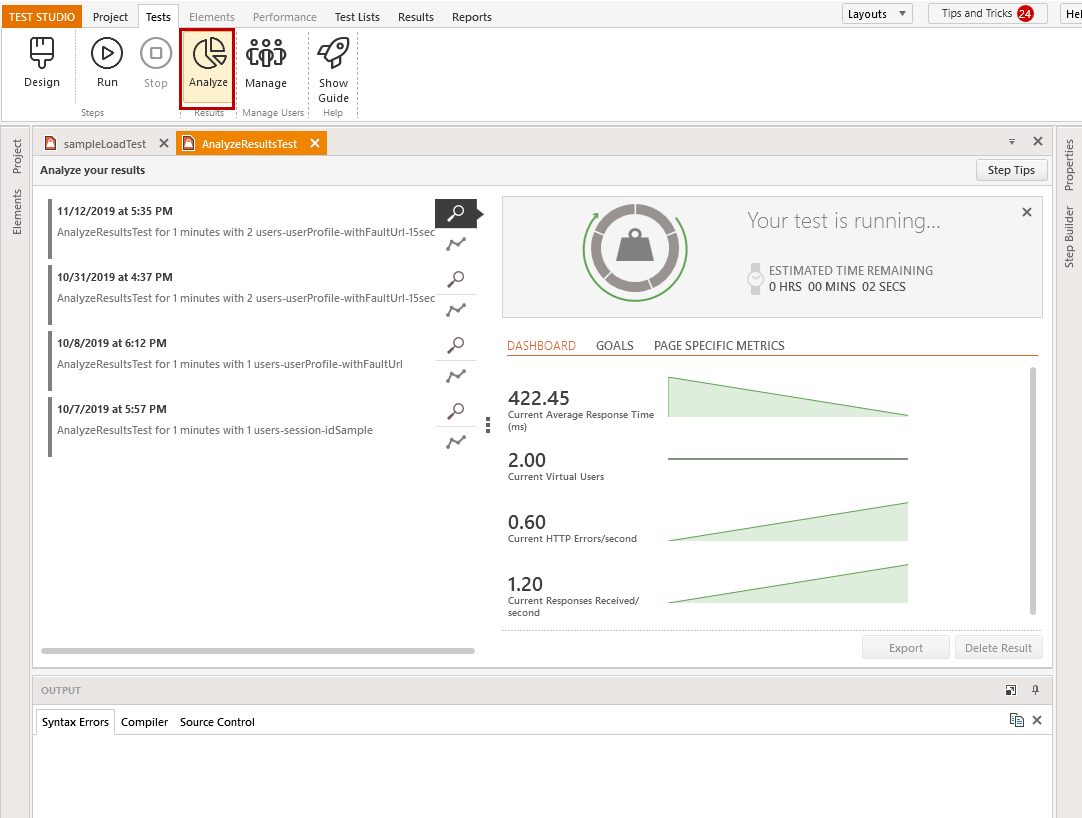
The current running test results appear at the top of the list with all previous runs of the same load test. This screen shows the aggregated data collected from all of the load agents, including the case when running a load test on multiple machines.
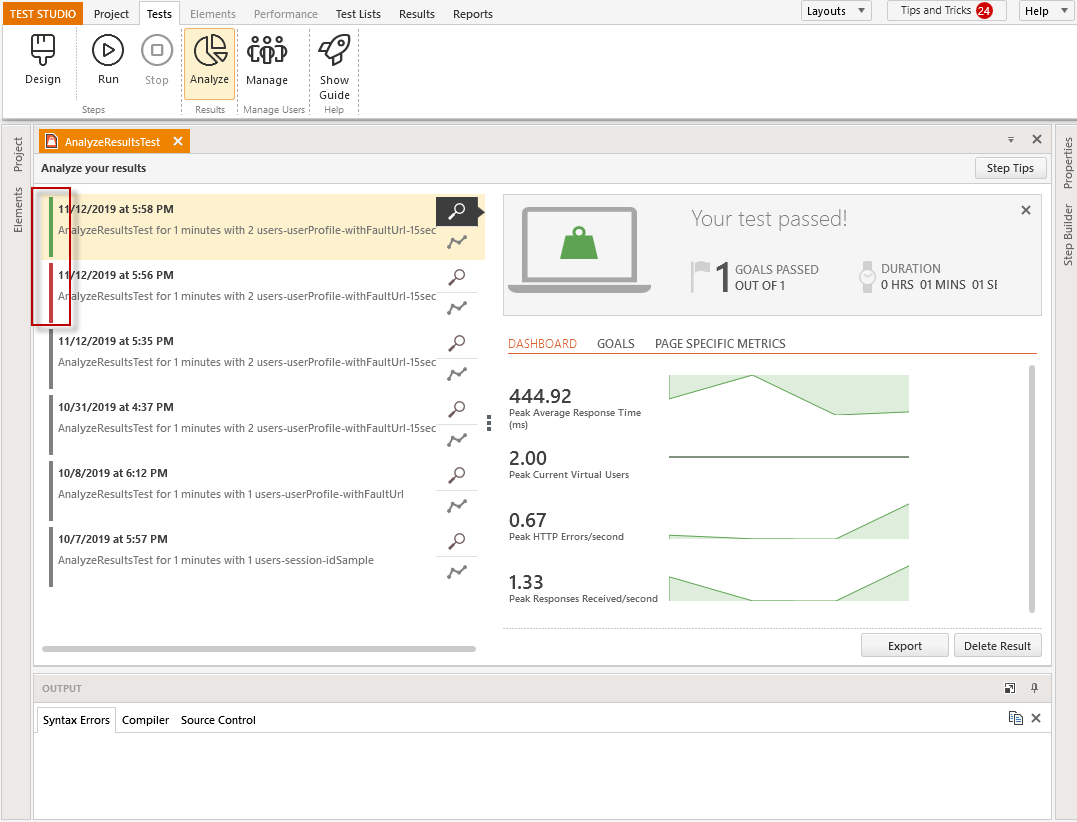
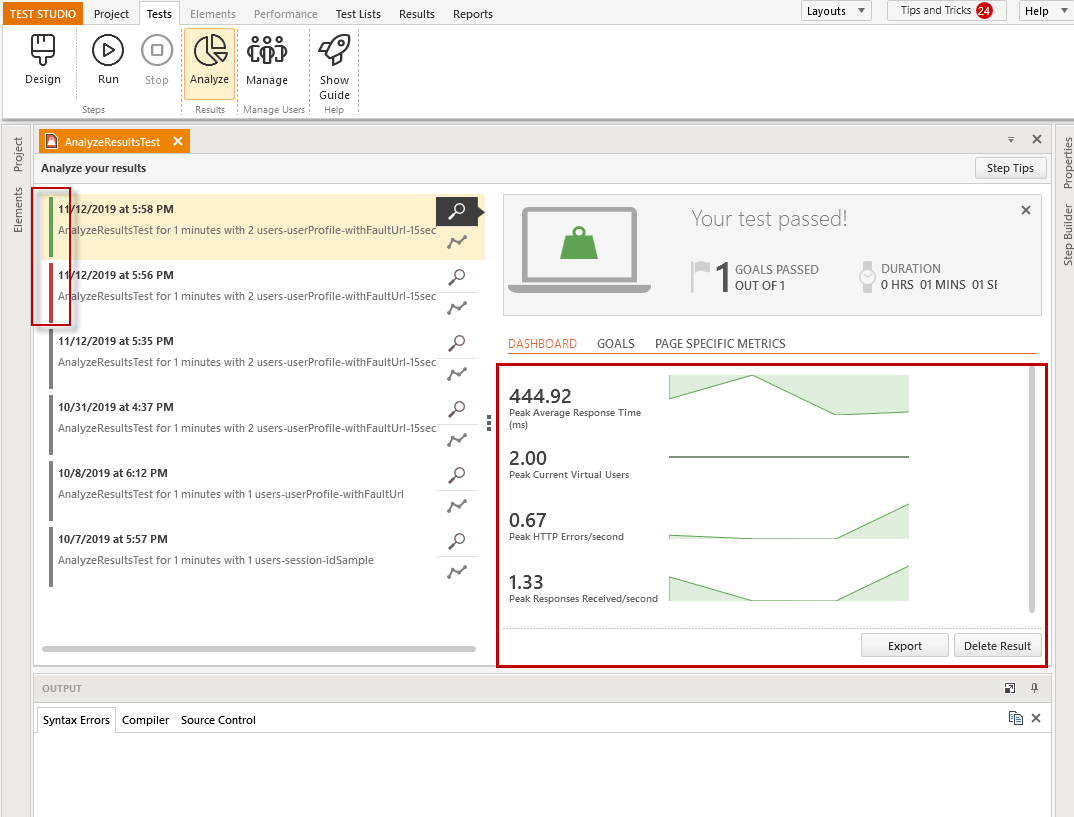
In the case when using test run goals to determine whether a test is failed or passed, the run result will be marked with a red or green vertical bar to the left.
Overall Results of the Load Test Run
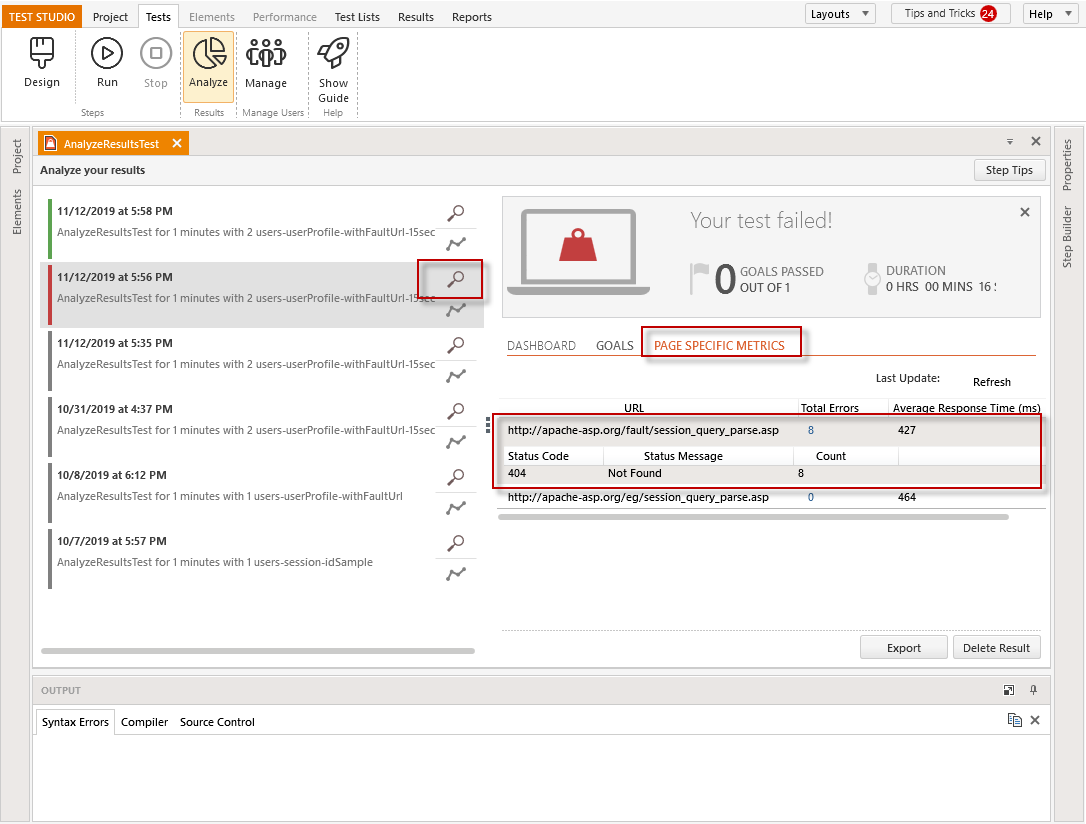
The Overall Results can be accessed through the 'Magnifier' icon for each load test run and are also automatically displayed and updated live during the test run. Here you can export the results, or delete the current load test run results.
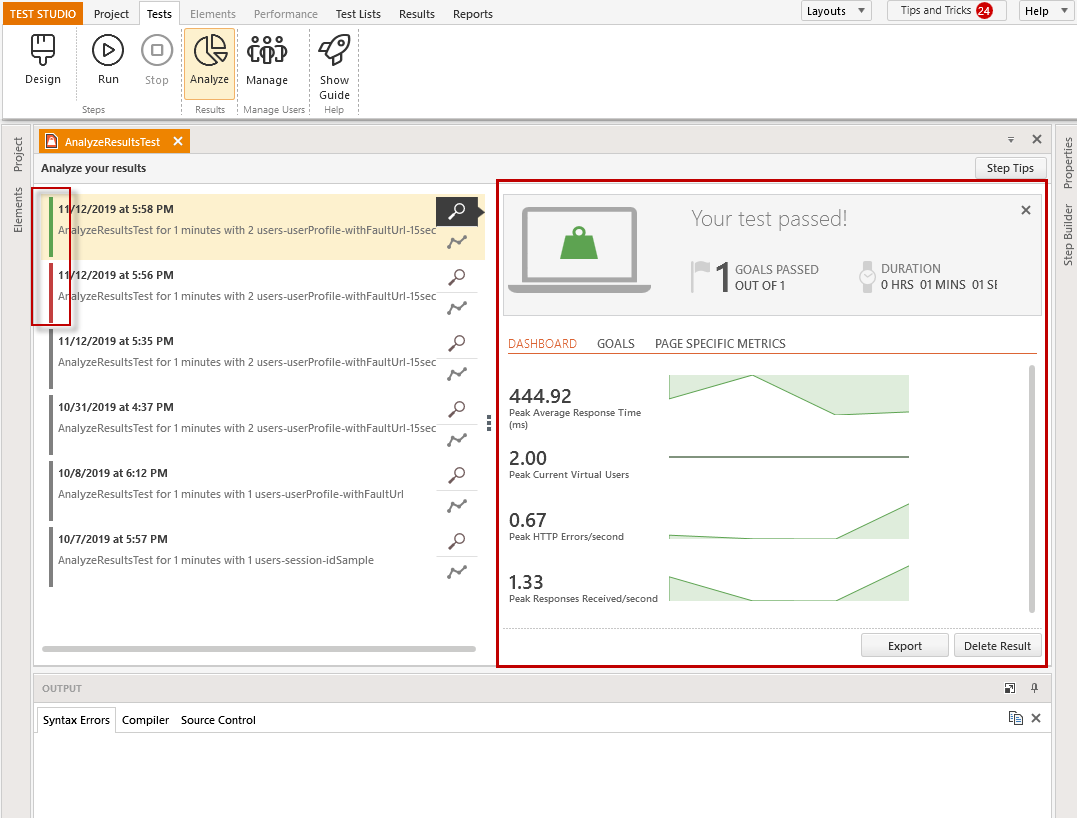
These are separated in three tabs - Dashboard, Goals and Page Specific Metrics, to help you easier sort the necessary details.
Dashboard Results
The Dashboard tab displays graphs of the progress for few of the gathered metrics during the test run and the peak value for these, based on the entire test run for finished execution, or based on the so far collected sampling for a running test. These are Peak Average Response Time, Peak Current Virtual Users, Peak HTTP Errors/second, Peak Responses Received/second.
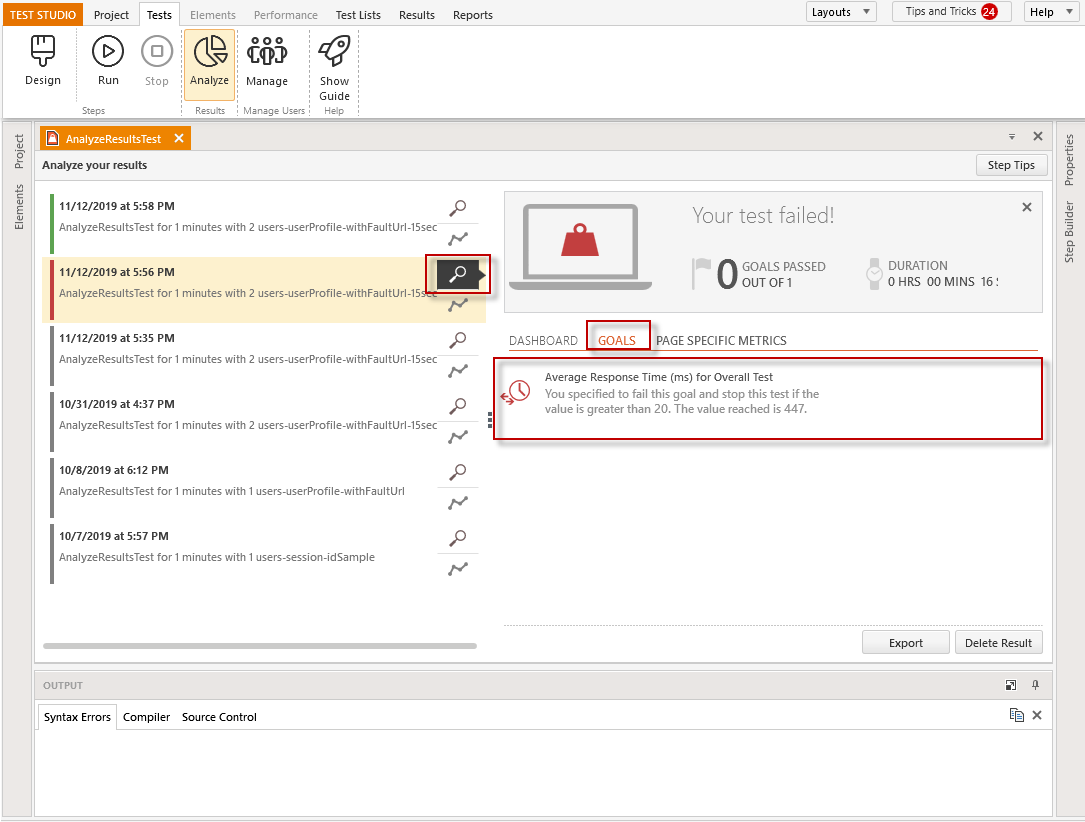
Goals Results
The Goal tab is empty for load test runs without set goals.
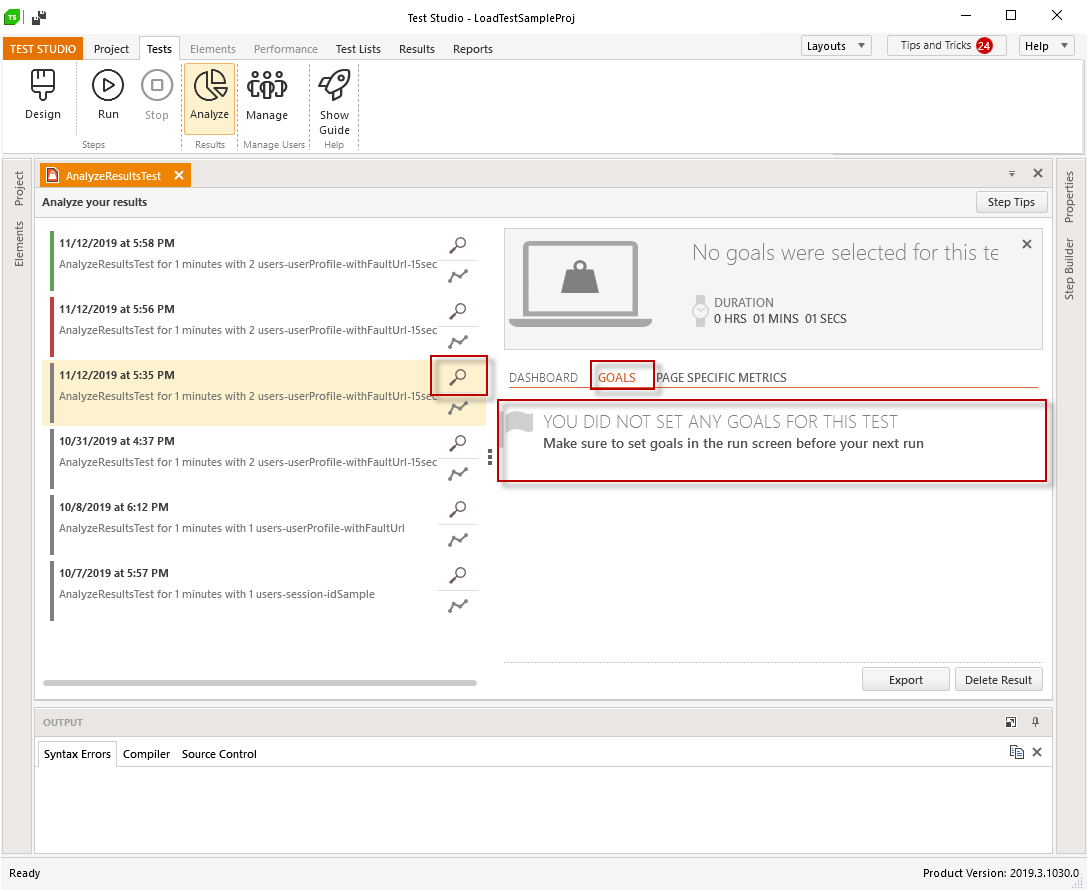
When the load test is using goals to determine its outcome, the Goals tab shows details for the particular goal.
Page Specific Metrics Results
The Page Specific Metrics tab provides details for each separate URL in the load user profile - what its average response time is and if it generated any HTTP errors.
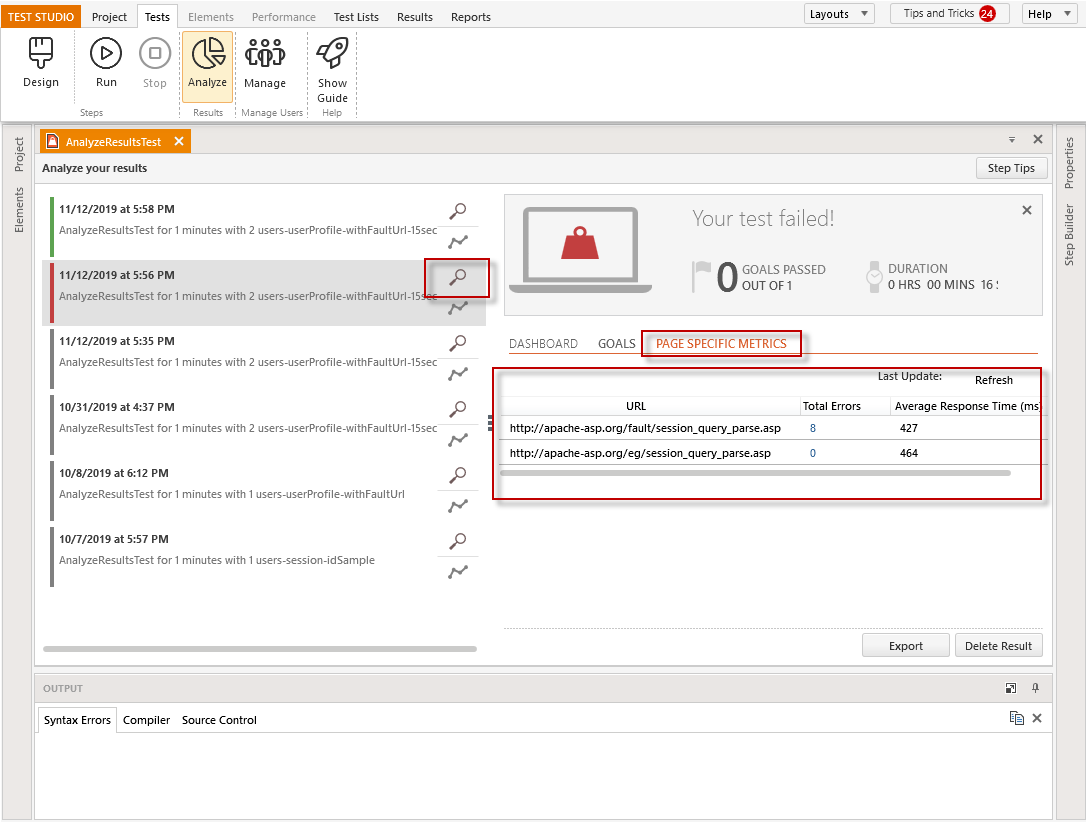
A click on any of the listed URLs, opens additional details for the HTTP response code and status message.
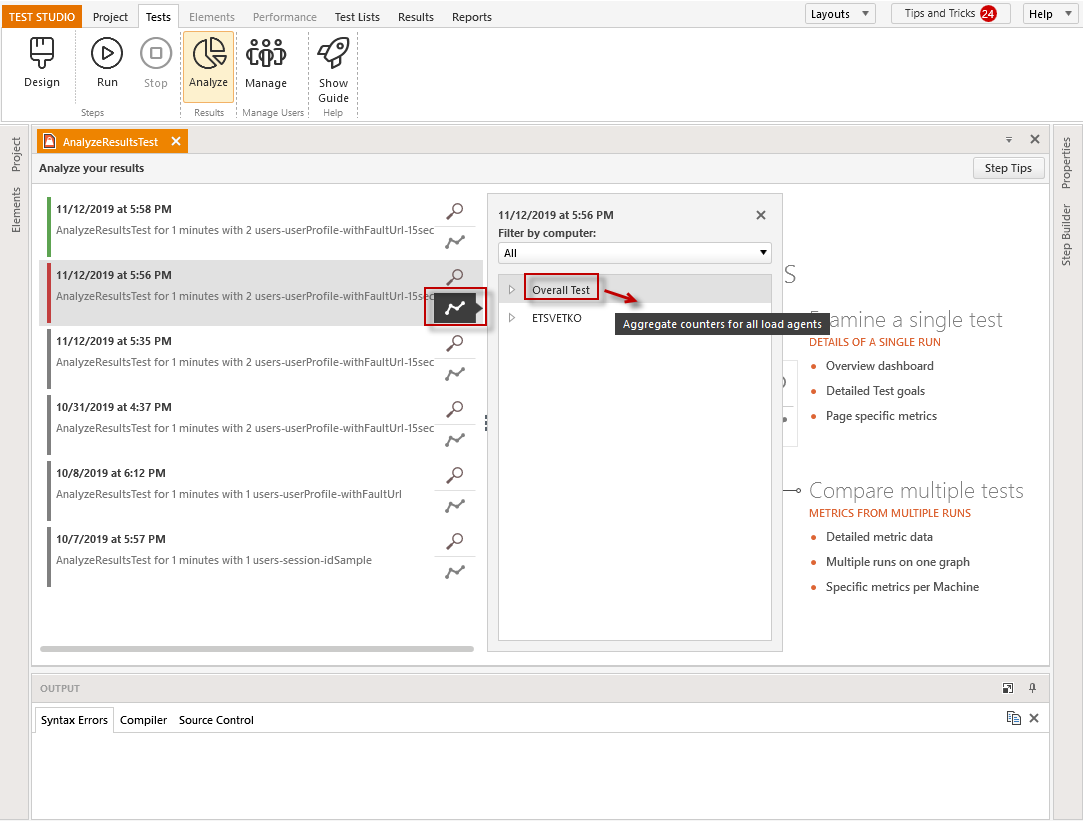
Analyze Detailed Metrics from the Load Test Run
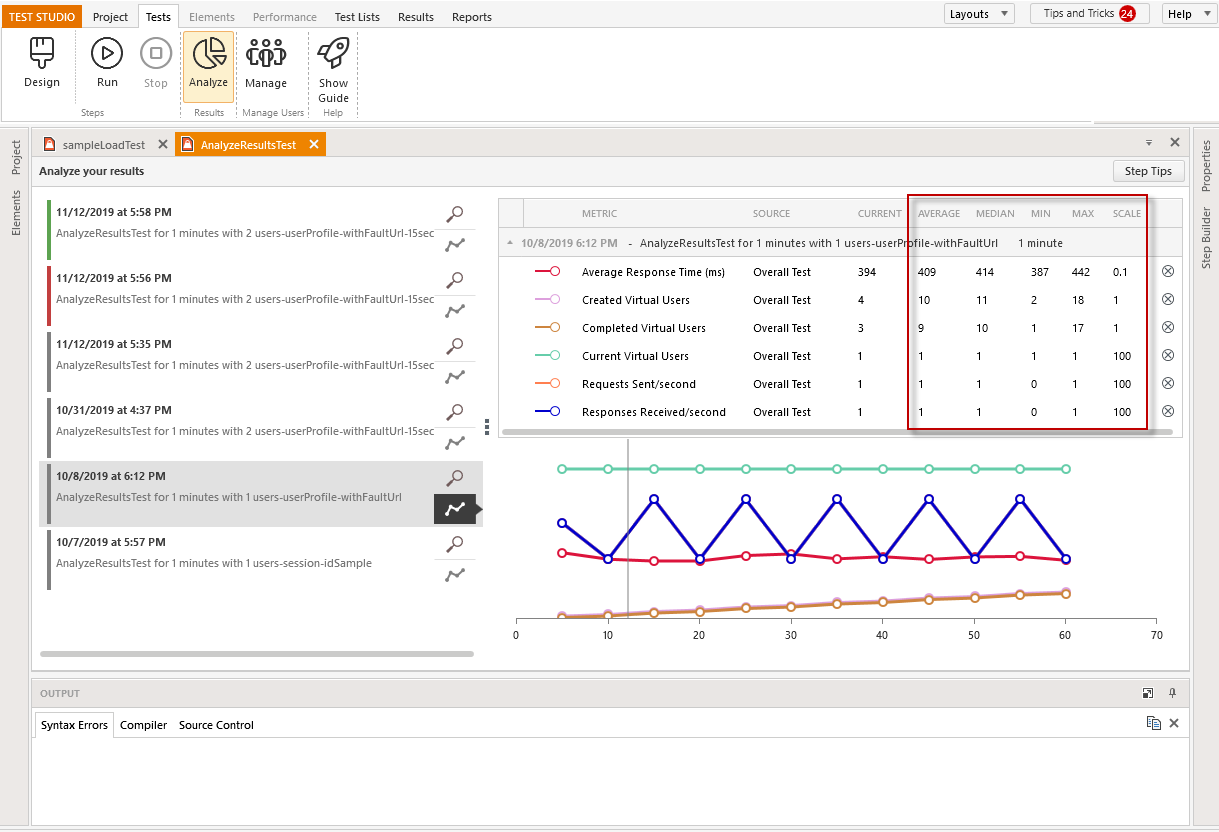
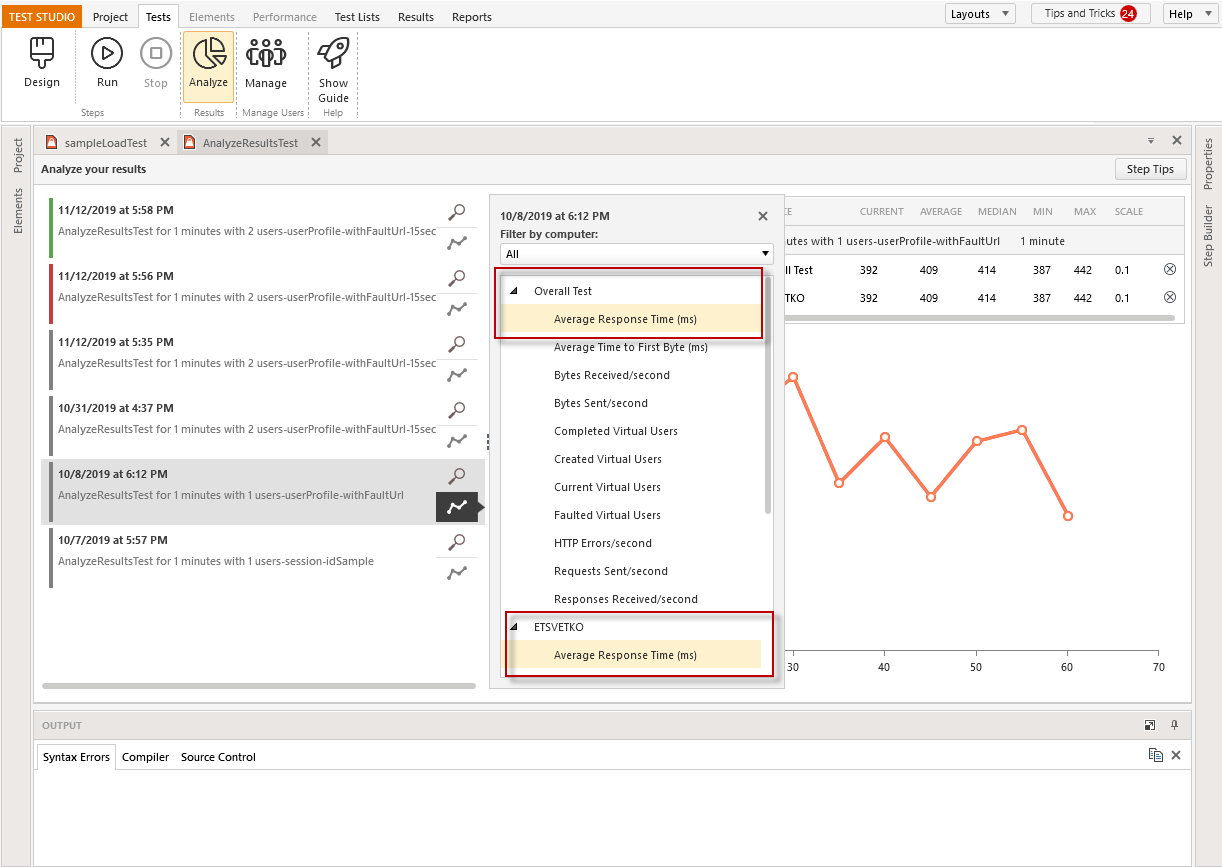
Each load test result includes detailed data for further metrics collected during the run. These are grouped under the 'Graph' icon and you can choose for analysis between the overall test metrics, or per machine specific metrics, for the case of using multiple machines to run the load test.
You can choose up to six of the listed metrics and these appear in the Result view as a table with statistical calculations and a graph view for better presentation of the test run results,
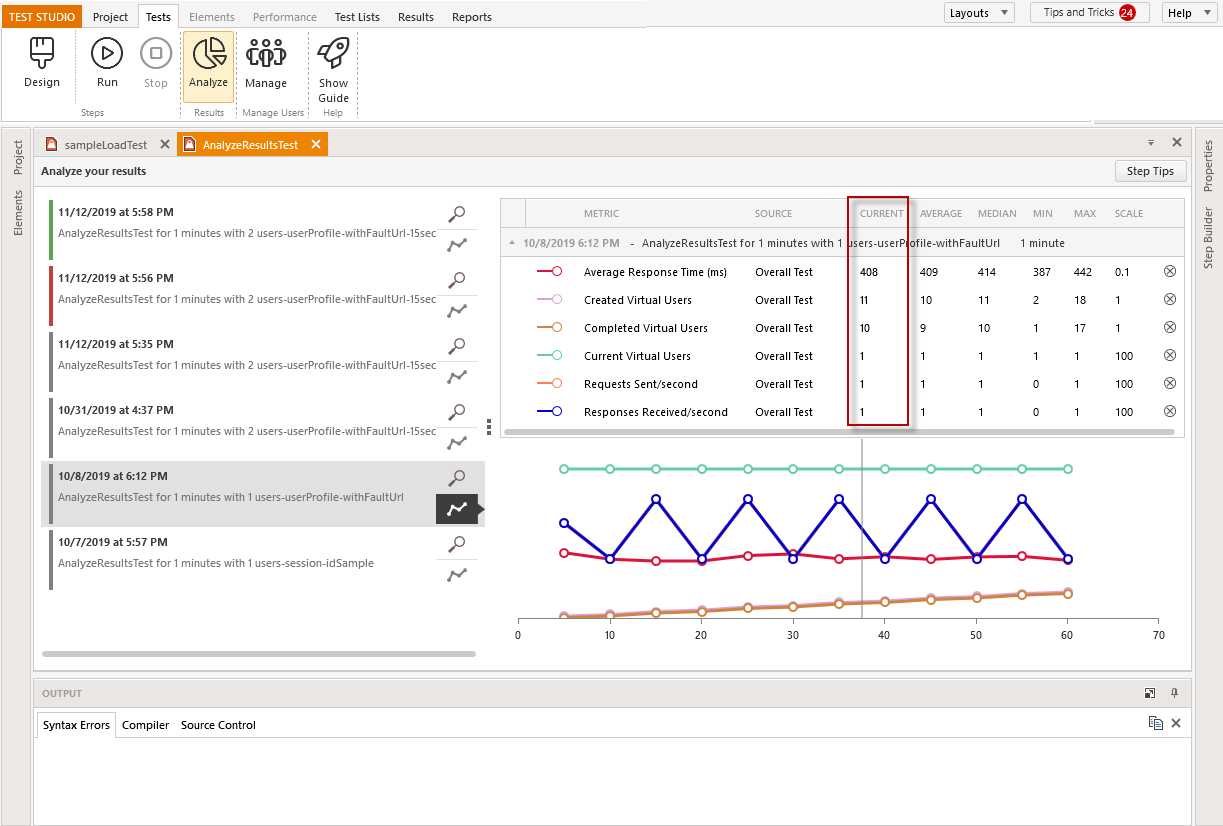
Moving the mouse through the graphical representation of the collected metrics, changes the values in the 'Current' column.
The rest of the columns in the statistical table remains the same - these represent Median, Max, Min and Scale values, which are constant and calculated based on the collected data from the selected run.
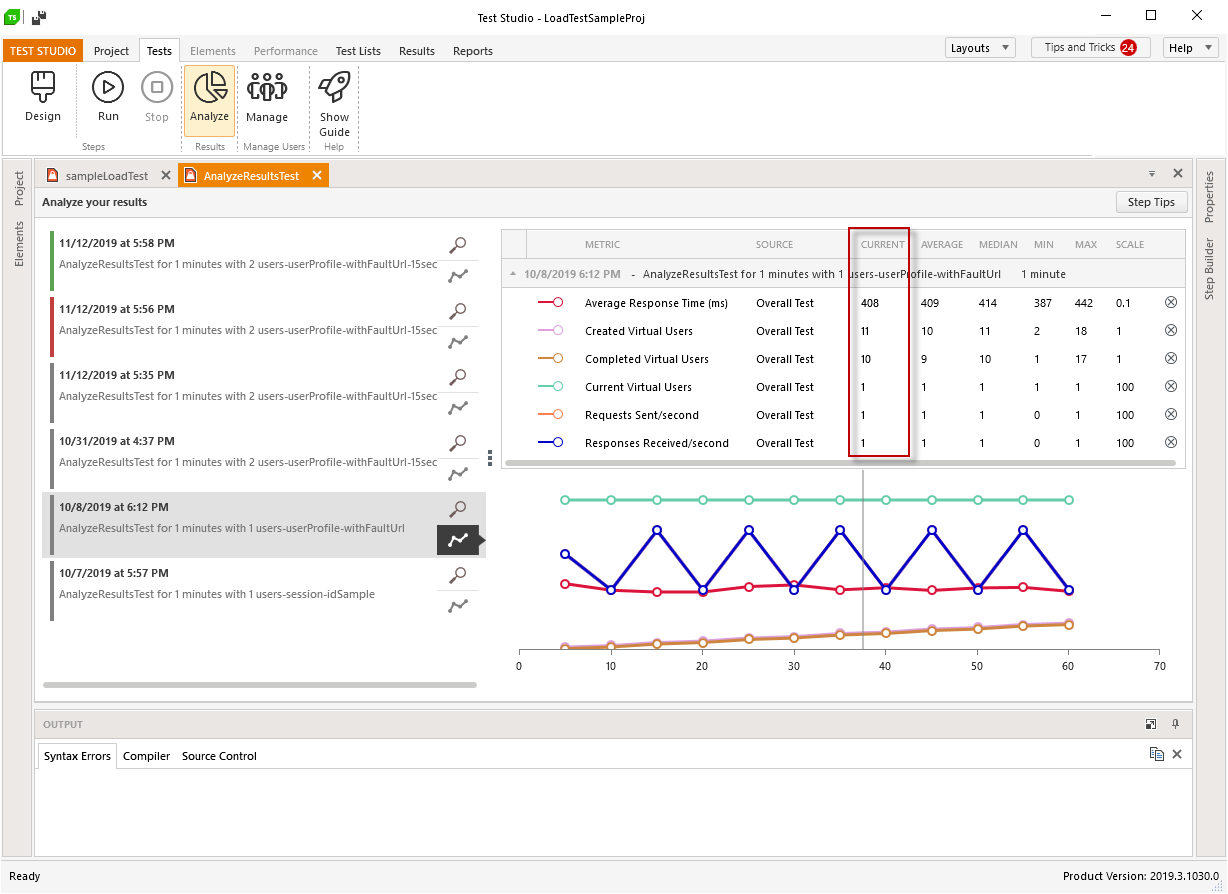
Compare Metrics from Load Test Runs
The Analyze screen in the Result view allows you to select metrics for comparison from different load agents and/or test runs.
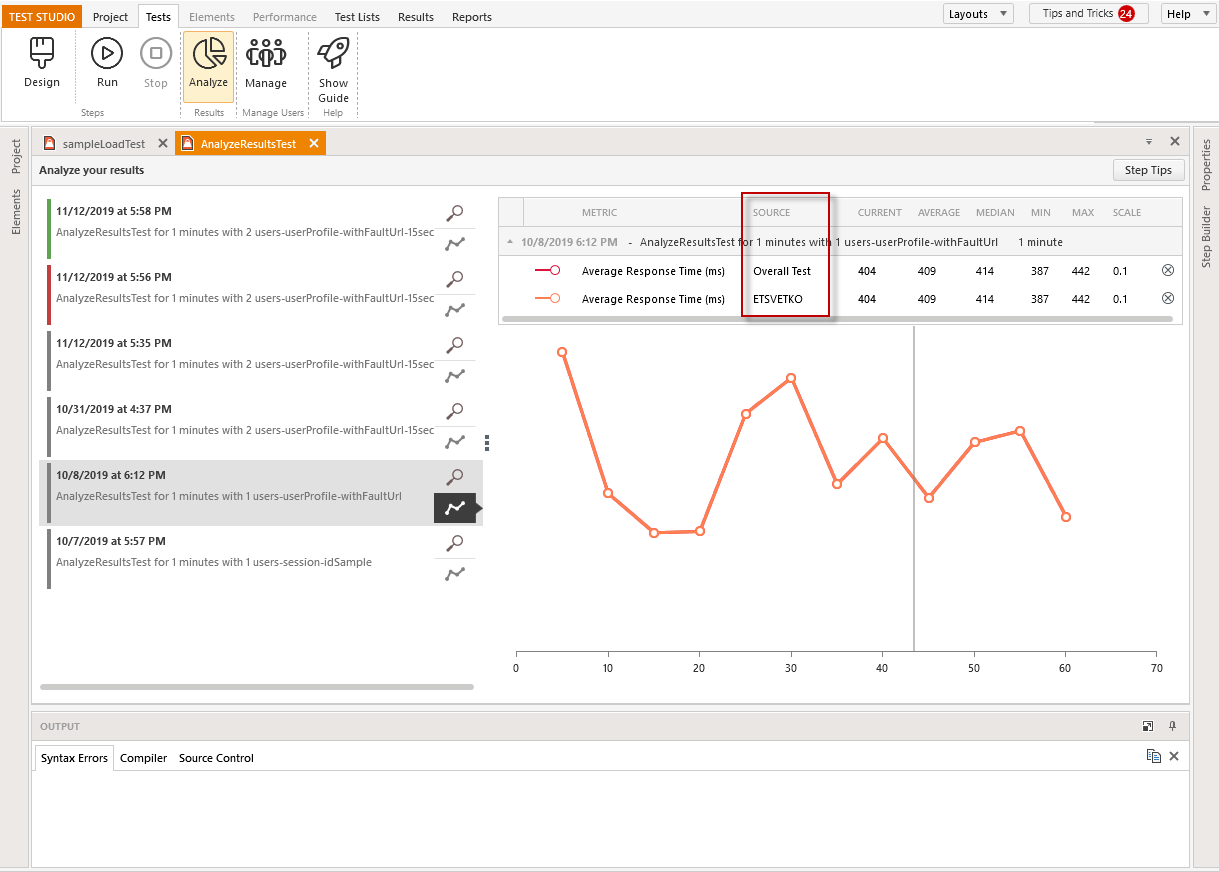
Compare Metrics from Different Load Agents
You can check and compare up to six of the collected metrics from the different load agents in a single run.
The sample test scenario was executed on a single machine and thus the collected data for Overall test and specific machine is basically the same -thus the graphs are one over the other. Still, the statistical table shows two rows for the different sources.
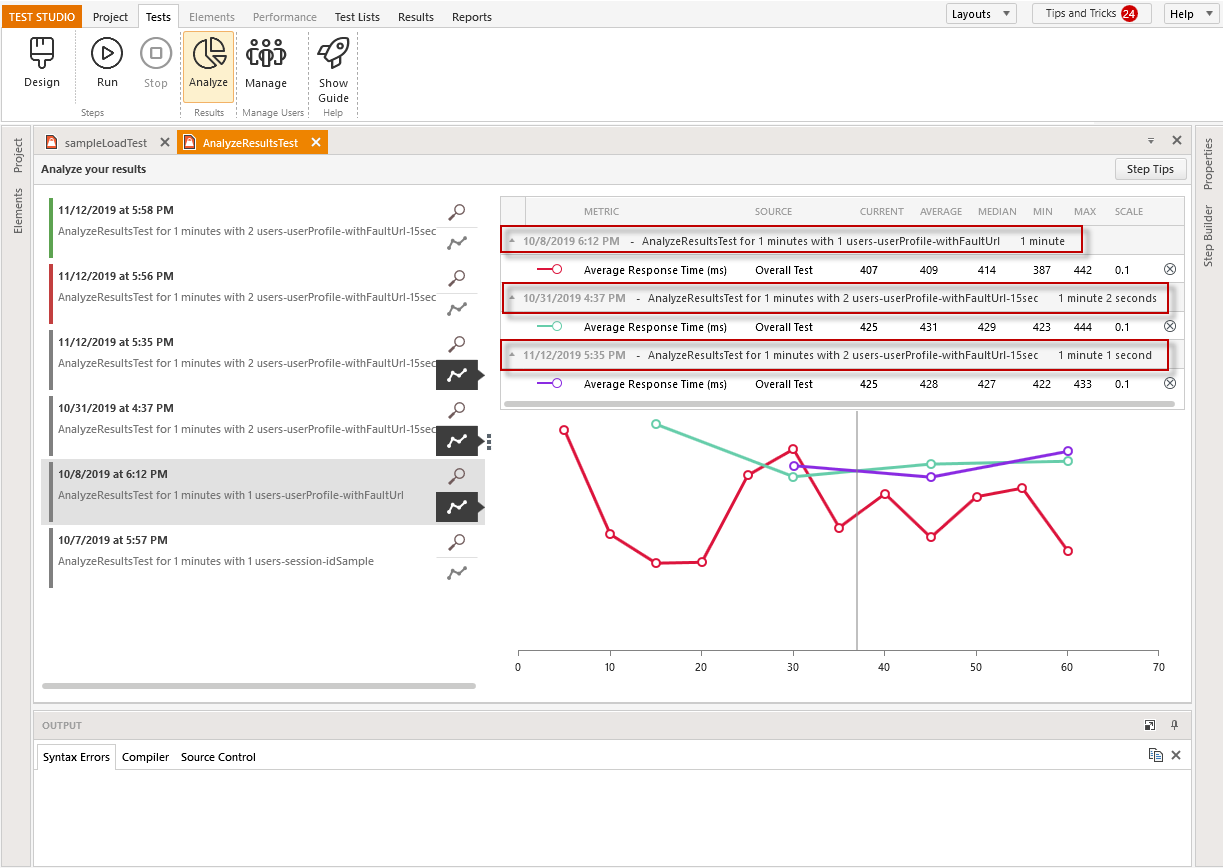
Compare Metrics from Different Test Runs
You can select up to six metrics to compare in the Analyze screen from different test runs.
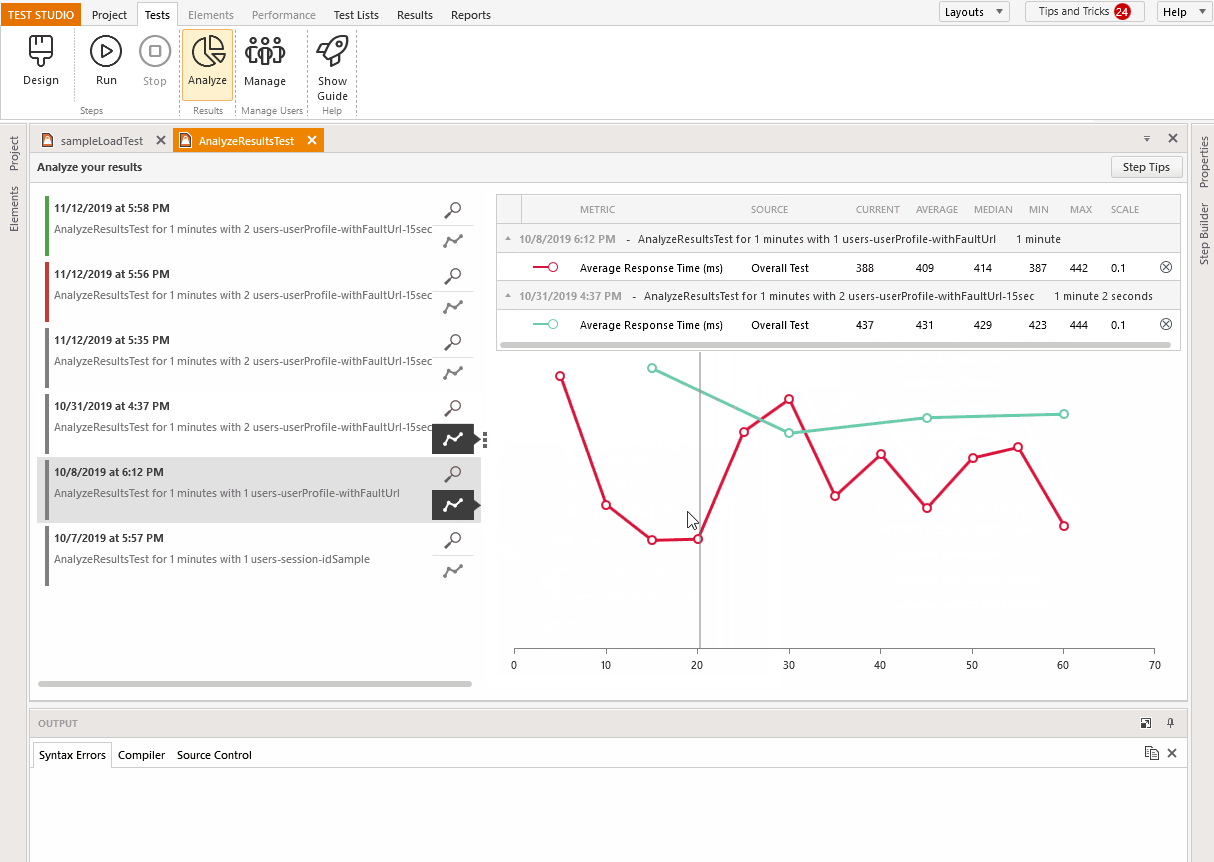
The table with statistical values shows the description of each test run and which is the selected load agent to present data for.
Collected Metrics Description
| Metric | Description |
|---|---|
| Average Response Time | Over the life of the test, the average of how long each user response took to be received. Time is measured from when the request was sent to when the end of the response was received. |
| Average Time to First Byte | Over the life of the test, the average amount of delay between when the HTTP request was sent to when the response was received. |
| Bytes Received per Second | The total number of bytes received per second across all virtual users. Only information contained in the body of the response is counted. Header information is not counted. |
| Bytes Sent per Second | The total number of bytes sent per second across all virtual users. Only information contained in the body of the request is counted. Header information is not counted. |
| Completed Virtual Users | The total count of all virtual users over the life of the test that completed all of their requests without faulting. |
| Created Virtual Users | The total count of all virtual users over the life of the test that were created. |
| Current Virtual Users | The number of active virtual users at the time a load measurement was taken. |
| Faulted Virtual Users | The total count of all virtual users over the life of the test that had a fault, such as an internal exception. |
| HTTP Errors Per Second | The number of HTTP errors received across all virtual users per second. The load test agent counts HTTP status codes between 400 and 599 as errors and any general unhandled exception while making the HTTP request to the web server, e.g. the HTTP connection was closed, as an error. |
| HTTP Errors Per Second | The number of HTTP errors received across all virtual users per second. The load test agent counts HTTP status codes between 400 and 599 as errors and any general unhandled exception while making the HTTP request to the web server, e.g. the HTTP connection was closed, as an error. |
| Requests Sent per Second | The number of HTTP requests sent per second across all virtual users. |
| Responses Received per Second | The number of HTTP responses received per second across all virtual users. |