Axes
The Chart enables you to set its axis title, plot bands, and apply global settings to all axes.
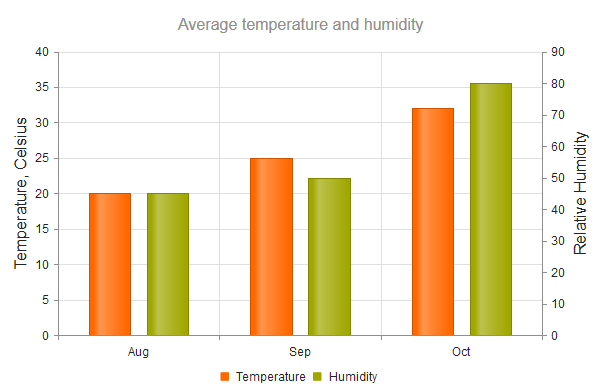
Configuring the Title
To clearly indicate the role of the axis, add an axis title.
$("#container").kendoChart({
    title: {
        text: "Average temperature and humidity"
    },
    legend: {
        position: "bottom"
    },
    series: [{
            name: "Temperature",
            data: [20, 25, 32],
            axis: "temperature"
        }, {
            name: "Humidity",
            data: [45, 50, 80],
            axis: "humidity"
    }],
    categoryAxis: {
        categories: ["Aug", "Sep", "Oct"],
        axisCrossingValue: [0, 3]
    },
    valueAxis: [{
        name: "temperature",
        title: {
            text: "Temperature, Celsius"
        }
    }, {
        name: "humidity",
        title: {
            text: "Relative Humidity"
        }
    }]
});
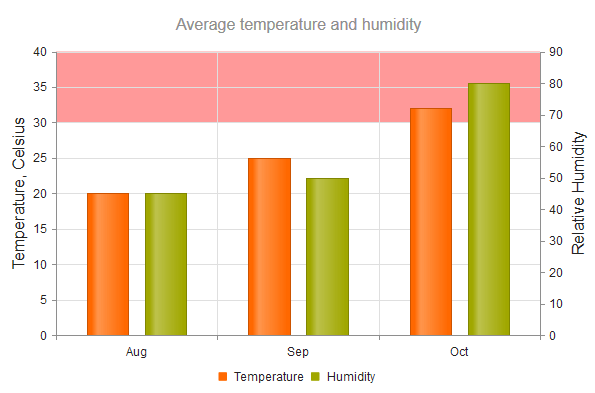
Setting the Plot Bands
You can configure each axis so that it displays bands with different colors for predefined value ranges. The category index (zero based) is used as a value for the category axis.
valueAxis: [{
    name: "temperature",
    title: {
        text: "Temperature, Celsius"
    },
    plotBands: [{
        from: 30,
        to: 40,
        color: "#f99"
    }]
    }, {
    name: "humidity",
    title: {
        text: "Relative Humidity"
    }
}]
Applying Global Settings
To apply settings to all axes, use the axisDefaults object.
$("#chart").kendoChart({
    series: [{
        type: "scatter",
        name: "Pentium D 915",
        data: [[120, 102]]
    }],
    axisDefaults: {
        labels: {
            font: "16px Verdana"
        }
    }
});