Live Traffic Grid
The Traffic pane provides essential features of Fiddler Everywhere including the captured traffic visualized within the Live Traffic grid.
Live traffic summarizes each captured session that shows in the Live Traffic grid. It also provides functionalities to work with these sessions through the Live Traffic toolbar, the Inspectors types, and the corresponding Rules tab. The feature enables the saving and sharing of sessions, editing issued requests, marking, commenting sessions, and applying rules.
Defining a Session
A (web) session represents a single transaction between a client and a server, sometimes known as a request/response pair. Each session appears as a single entry in Live Traffic grid. Each session object has a Request and a Response, representing the data the client sends to the server and the data the server returns to the client. The session object also maintains a set of flags that record metadata about the session and a timers object that stores timestamps logged during the processing of the session.
Live Traffic Toolbar
The toolbar of the Live Traffic section provides various functionalities such as filtering by multiple criteria, using independent browser instances, searching, saving, and sharing sessions, and managing the user interface.
The Live Traffic toolbar provides the following functionalities:
- Filtering Traffic (Filters)
- independent Browser Capturing (Open Browser)
- independent Terminal Capturing (>_Terminal)
- Clearing Sessions (Clear)
- Searching (Quick Search)
- Saving Sessions (Save)
- Sharing Sessions (Share)
- Managing Columns (Columns)
- Toggling Layout(Toggle Layout Change)
Filtering Traffic
Use the filtering options (the Filters toolbar option and the column filters) to create and apply complex filters on your captured sessions in the Live Traffic grid.
Learn more about the filtering options in Fiddler Everywhere...
Independent Browser Capturing
Use the Open Browser button to capture traffic from a specific browser instance without modifying the system proxy settings.

Learn more about the independent browser capturing...
Terminal Capturing
Use the >_ Terminal button to capture traffic from a specific terminal instance without modifying the system proxy settings.

Learn more about the independent terminal capturing...
Clearing Sessions
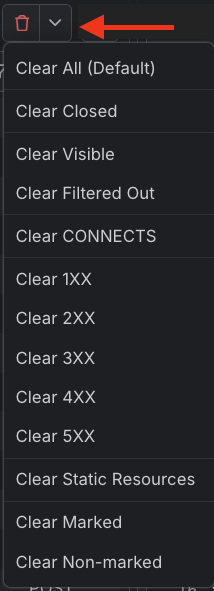
The Clear button will remove all captured traffic from the Live Traffic grid. The action requires explicit confirmation. To remove only specific sessions, select the targeted sessions and use the Clear option from the context menu.
You can also clear only a specific set of sessions based on some pre-defined criteria. The complete list of Clear xxx options is available through the dropdown menu next to the Clear button, and the available options are as follows:
- Clear All—Removes all entries from the traffic grid (an analog to the Clear button).
- Clear Closed—Removes all sessions with session state "Closed". The state of the session is available through the Session State column.
- Clear Visible—Removes all sessions currently visible in the grid. Will preserve filtered sessions (these sessions will return if the filters are cleared).
- Clear Filtered Out—Removes all sessions that are filtered.
- Clear CONNECTS—Removes all sessions that use HTTP method CONNECT (also referred to as proxy tunnels).
- Clear XXX—Removes all sessions where the received HTTP status code is XXX.
- Clear Static Resources—Removes all sessions that return static resources like text or images.
- Clear Marked—Removes all sessions from the grid marked through a rule or from the context menu. This action will remove all session made with CONNECT method (because they are marked by default).
- Clear Non-Marked—Removes all sessions from the grid that are not marked through a rule or from the context menu.
Searching
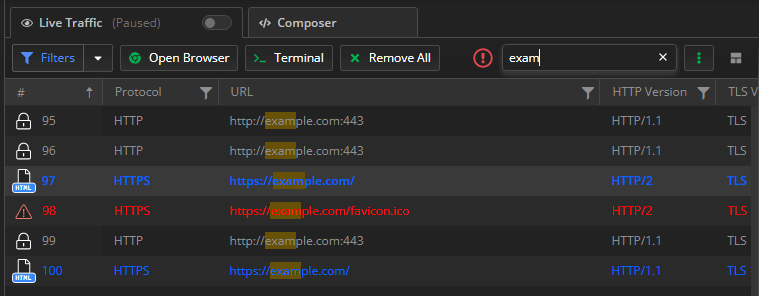
To search for specific values in the URL and the headers of all sessions, use the Quick Search text input. The search action immediately filters all sessions containing the search terms and highlights the matched data. If a match is in a hidden column (for example, due to an applied filter), a warning icon shows next to the search box, which helps you show the column(s) quickly.
Searching within Request and Response Bodies
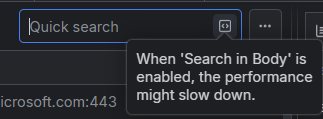
Version 5.9.0 of Fiddler Everywhere introduced the option to quickly search within multiple response bodies as a feature requested by the community. Note that in some cases, the Fiddler Everywhere application can search in hundreds or even thousands of sessions that can have large HTTP bodies - the immediate result of a similar search could lead to degradation of the performance (due to the processing time and memory resources needed to complete the search). It's recommended to use the search in bodies feature only with a smaller set of captured sessions.
To enable the feature to search in bodies, toggle the button at the right end of the Quick Search input field.
Saving Sessions
To save captured sessions, use the main menu's Save button, automatically saving all captured traffic. To save only specific sessions, select the desired ones and use the advanced saving options from the context menu.
To save sessions for later or prepare sessions for sharing:
Click the Save button. As a result, a Save Sessions prompt window appears.
Enter a session name in the Give your session a name field.
Choose whether to store the session in the Local Storage or in the Cloud Storage.
(Optional) Choose a folder (within the Fiddler UI) to store the session.
(Optional) Use the password protection switch to enable encryption and set a password.
Click Save. The saved sessions load in the Snapshots tree list.
Sharing Sessions
Sharing sessions dramatically improve collaboration, and Fiddler Everywhere provides the following options to export and share sessions:
Sharing through the Share button from a saved session entry in the Snapshots tree list.
Sharing through the Share option from the Live Traffic grid context menu.
Sharing through the Share button from the Live Traffic grid toolbar. The Live Traffic toolbar comes with a Share button that will save in a file the currently displayed sessions, captured within the Live Traffic grid, and then will share them through an explicitly provided email.
To share a session through the toolbar:
Click the Share button. As a result, the Save Snapshot prompt window appears.
In the Save Snapshot prompt window, enter a valid name and choose a folder to store the session.
In the Share Snapshot prompt window, enter a valid email and click Share. Entering notes is optional.
Managing Columns
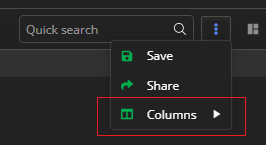
Use the Columns menu to manage which columns to show up in the Live Traffic grid.
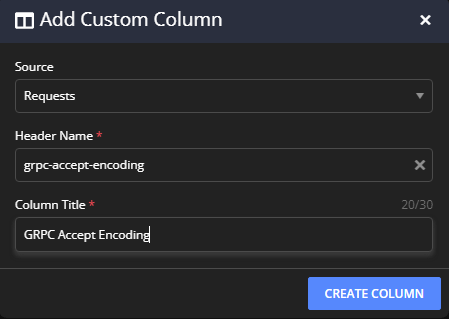
You can also create a custom column through the Add Custom Column option near the bottom of the menu.
Learn more about each column present in the Live Traffic grid here...
Toggling Layout
The last icon on the right side of the toolbar presents an option to restructure the main Fiddler Everywhere layout structure for the Live Traffic grid and the Inspectors. The layout change option is available for the Live traffic tab, comparison, and saved sessions tabs. The layout options are as follows:
- (Default layout) Live Traffic grid on the left side and the Inspectors on the right (top for Request Inspectors and bottom for Response Inspectors).
- (Alternative layout) Live Traffic grid at the top and the Inspectors at the bottom (left for Request Inspectors and right for Response Inspectors).
You can collapse or expand the Snapshots and Requests side panels and toggle the main layout to optimize your working space.
Live Traffic Grid
The Live Traffic grid displays all captured web sessions with their technical details structured in columns.
Many operations start by selecting one or more entries in the Live Traffic grid and activating other features.
To select more than one session, hold the Ctrl (Command on Mac) or Shift keys while clicking the desired rows.
Double-click or press Enter (Return on Mac) to activate the default inspectors for a single selected session.
When the Inspectors are activated, they will automatically decide which inspector type is best suited to display the request and response of the selected session.
List Icons
The Live Traffic grid uses icons to provide additional context for each recorded session. To trigger an explanatory tooltip, hover over a Live Traffic grid entry icon.
The following table displays the icons which Live Traffic grid supports for its entries:
| Icon Name | Description |
|---|---|
| Represents a generic successful response. | |
| Uploading content for a session in progress (the request is being sent to the server). | |
| Uploading paused for the session in progress. | |
| Downloading content for the session in progress (the response is being read from the server). | |
| Downloading paused for the session in progress. | |
| The session was aborted by the client, Fiddler, or the Server. | |
| The response was a server error. | |
| The response returned status code 401 Unauthorized. | |
| The response redirect status code 300, 301, 302, 303 or 307. | |
| A tunnel is used for WebSocket traffic. | |
| The request used the HTTP CONNECT method - establishes a tunnel used for HTTPS traffic. | |
| A tunnel used for RPC traffic. | |
| No content loaded. | |
| Not modified. | |
| Partial content. | |
| The response was an image. | |
| The response was a JavaScript file. | |
| The response was a CSS file. | |
| The response was an HTML file. | |
| A tunnel is used for GRPC traffic. | |
| The response was a Flash file. | |
| The response was an XML file. | |
| The response was a Silverlight file. | |
| The response was an audio file. | |
| The response was a video file. | |
| The response was a font file. | |
| The response was a JSON file. | |
| The request used the POST method. |
Breakpoint Indicators
A paused session or otherwise a session that hit an active breakpoint will have a special "Paused" icon in the Live Traffic grid.
Certificate Indicators
Each list icon can contain an additional triangle warning that indicates different server certificate issues.
-
A small orange triangle warning indicates that the server uses a certificate that is about to expire within 30 days. You can expand and inspect the certificate expiration warning in detail through the Response inspector notification.

-
A small red triangle warning indicates that there are certificate errors. You can expand and inspect the certificate error in detail through the Response inspector notification.

-
Absence of the triangle warning means no issues with the server certificate. You can still expand and inspect the used certificate in detail through the Response inspector notification.

Learn more about how to use the server certificate details in Fiddler Everywhere here...
Columns
The following table lists the Live Traffic columns and the information they display. Apart from just being a descriptive tag, each column name can be applied as a matching condition within filters and rules (for example, you can create a filter or rule that matches TLS Version column values and apply actions applicable only for a session with TLS 1.3). In addition to the predefined columns listed below, Fiddler Everywhere allows you to create your own custom columns.
| Column name | Description |
|---|---|
| # | A unique identification number generated by Fiddler Everywhere. The column also contains an icon that represents the session type and might contain certificate expiration indicator. |
| Scheme | The protocol type (HTTP or HTTPS) used by the session. |
| Host | The hostname and the server's port to which the request was sent. The column also indicates requests with CONNECT method with the Tunnel to value (CONNECT tunnels in Fiddler). |
| Path | The path refers to the exact location of a page, post, file, or asset. The path resides after the hostname and is separated by a forward slash (/). |
| URL | The URL contains the protocol, the hostname, the port, and the path from the request. |
| Client HTTP Version | The protocol version used for communication between the client and Fiddler (HTTP/1.1, HTTP/2) |
| Remote HTTP Version | The protocol version used for communication between Fiddler and the remote server (HTTP/1.1, HTTP/2) |
| Client TLS Version | The TLS version used for communication between the client and Fiddler. The possible values are SSL 2.0, SSL 3.0, TLS 1.0, TLS 1.1, TLS 1.2, and TLS 1.3. Learn more about the TLS version specifics in Fiddler Everywhere here... |
| Remote TLS Version | The TLS version used for communication between Fiddler and the remote server. The possible values are SSL 2.0, SSL 3.0, TLS 1.0, TLS 1.1, TLS 1.2, and TLS 1.3. Learn more about the TLS version specifics in Fiddler Everywhere here... |
| Status Code | The HTTP response status code |
| Method | The HTTP method used by the request that was made (GET, POST, PUT, and so on) |
| Process | The local OS process from which the traffic originated—for example, `chrome:8212` indicates a Google Chrome browser instance. |
| Client IP | Indicates the client IP that sent this request. Mostly applicable when multiple computers on a network are pointed to a single Fiddler instance. |
| Remote IP | Indicates the IP address of the server used for this request. |
| Protocol | The protocol type (HTTP, gRPC, Socket.IO, etc.,) used by the session. |
| Session State | Indicates the session state as opened (active), closed or aborted. |
| Body Size | The number of bytes in the response body. |
| Caching | Values from the Expires and Cache-Control headers of the response. |
| Content-Type | The Content-Type header from the response. |
| Request Time | Indicates when the session was executed in an HH:MM:SS:ms format. |
| Request Date | Indicates the date when the session was executed in a MM:DD:YYYY format. |
| Duration | Indicates the duration (in milliseconds) that took for the session to complete. |
| Rules Modified | Indicates if the session is modified by active rules from the Rules tab. |
| Comments | Shows the custom comments added by you or the author of a shared session. |
Creating Custom Columns
Add, edit, or remove a custom column to the columns list. Afterward, the columns are visualized similarly to the Fiddler's predefined columns.
Add a custom column through one of these actions:
-
Open the Columns menu and the click on the Add Custom Column item.
-
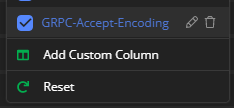
In the prompted custom column dialog, specify an HTTP Header (it's value will populate the column data) and assign a column name. The header's value will appear in the session grid if the header is present in the captured session. Otherwise, the column stays empty.
-
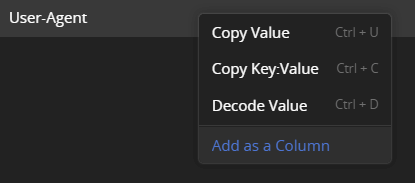
Open the Headers inspector in HTTP request/response, right-click on a selected header to load the context menu, and choose Add as a column.
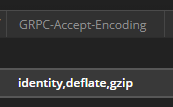
After the successful creation, the new column is immediately available in the Live Traffic grid. Adding a new column makes the new column visible in all tabs (both Live Traffic and opened snapshots). Unchecking the column is persisted per tab - it won't apply globally.
Edit a custom column through the Columns menu and click the edit icon. Remove a custom column through the Columns menu and click on the remove icon (a deletion confirmation displays).
Filter by a custom column through the filtering button to the right of the column name.
Reset Columns
To reset all columns to their default Fiddler's state, open the Columns menu and use the Reset option at the bottom. This action resets all columns (shows the default selection) but won't remove any custom-made columns (it will only hide them).
Traffic Sorting and Filtering
By default, the captured traffic is sorted in the order sessions appear during the traffic capturing, sorted by the unique identification number column, and no active filters are applied. You can use the built-in sorting and filtering options to optimize the outcome.
Sorting Options
To create a custom sorting order, click the desired column. For example, click the URL column to sort alphabetically based on the URL or click the Body Size column to sort based on the session size in bytes. The default sorting order is based on the unique identification number (order of appearance).
Filtering Options
Each column has a filter button, which popups an additional Filter menu to create.
The column Filter menu lets you add filters for the currently selected column —for example, filter all the traffic by the host name or by a specific status code. Columns with active filters will have a blue filter indicator. You can remove a column filter through the Clear button in the Filter menu (for the filtered column) or through the Filters toolbar option.
Apply complex filters by using the Filters toolbar option (which supports all Fiddler's columns as possible match conditions) or learn more about the Column Filters options.
Context Menu Options
The context menu for the Live Traffic grid exposes actions you can apply for one or more sessions. To show the context menu, right-click (Windows OS), or press Control and mouse-click (macOS).
- Replaying (Replay)
- Editing in the Composer (Edit in Composer)
- Resuming Paused Sessions (Resume Paused Sessions)
- Adding New Rules (Add New Rule)
- Adding Sessions to Existing Snapshots (Add to Snapshot)
- Saving (Save)
- Exporting (Export)
- Sharing (Share)
- Removing (Remove)
- Marking (Mark)
- Copying (Copy)
- Selecting (Select)
- Comparing (Compare)
- Adding Sessions to Compare Groups (Add to compare group)
- Commenting (Comment)
- Bypassing the Proxy (Bypass)
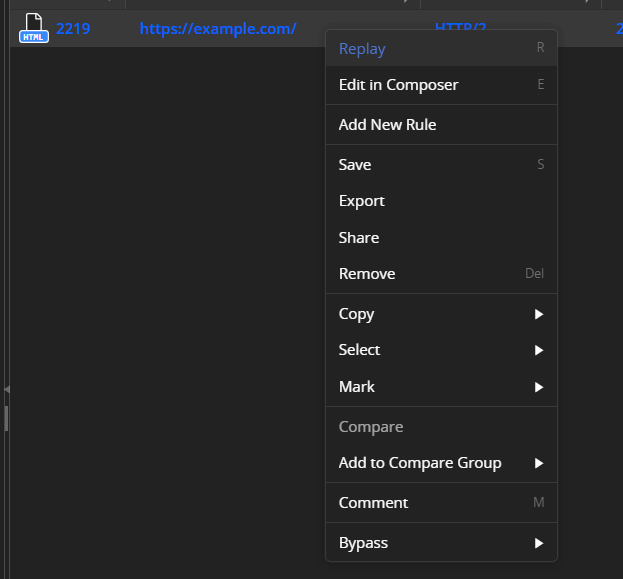
Replaying
To replay previously captured sessions, use the Replay context menu option, which can be accessed with the keyboard by pressing R.
Editing in the Composer
The Edit in Composer context menu option loads the selected request in a new composer window where it can be edited, saved for later usage and sharing, and reissued.
Resuming Paused Sessions
To resume the execution of sessions that hit active breakpoints, use the Resume Paused Sessions context menu option, which can be accessed with the keyboard by pressing F5.
Adding New Rules
You can use a captured session entry to quickly mock client or server behavior. For similar cases, you can use the session URL alongside the Rules tab. Creating rules allows you to test complex scenarios and various mock responses.
To add a new rule:
Select the desired session entry and right-click to open the context menu. Select Add New Rule.
A new rule is automatically created. The rule will use the URL from the selected session entry and, by default, will apply the initial response through the Manual Response action option.
Adding Session to Snapshot
You can add a captured session to an existing snapshot using the Add to Snapshot option.

This option opens a dialog that allows you to select the session snapshot to which you would like to add the captured sessions.

Saving
To save selected sessions, use the Save context menu option. The snapshot of saved sessions will appear in the Snapshots tree to the left of the Fiddler Everywhere interface, and from there, you can later re-open, export, and share them.
The option displays a Save prompt window. To save the desired sessions:
Select the sessions, open the context menu, and click the Save option.
Enter your session name and choose the folder storing the entry.
(Optional) Use the password protection switch to enable encryption and set a password. Only users with knowledge of the password can open the entry.
Click Save. The saved session immediately loads in the save Snapshots tree.
Double-click the saved session to load it in a new Composer tab. Note that encrypted sessions will prompt for a password before loading.
Alternatively, you can save all captured traffic through the Save button from the toolbar.
Exporting
The Export context menu option allows you to export the selected sessions in various formats such as SAZ (Fiddler Archive), HTTPArchive, WCAT, MeddlerScript, cURLScript, and more.
Sharing
The Share context menu option enables the sharing of selected sessions. Before any session is shared, it is saved as an entry in the save Snapshots tree. Then, the threshold can be transmitted through email.
The option initially displays a Save and then a Share prompt window.
Select the sessions, open the context menu, and click the Share option.
The selected sessions are saved. Enter your session name and click Save and proceed.
The Share prompt window appears. Enter a valid email and, optionally, add notes. Once ready, click Share. Note that when sharing an encrypted session, the recipient will need the password to access it.
Alternatively, you can share captured traffic through the Share button from the toolbar.
Removing
To delete a selected sessions from your Live Traffic grid, use the Remove context menu options.
Copying
To place session information in the clipboard, use the Copy context menu option, which supports the following options:
Copy URL(s)—Places the session URL in the system clipboard; Can be triggered with the keyboard by pressing
Cmd+U(on Mac), orCtrl+U(on Windows).Copy All Columns (Tab Separated)—Places verbose session details (from all visible columns in the Live Traffic grid or from saved session snapshots) in the system clipboard; Can be triggered with the keyboard by pressing
Cmd+C(on Mac), orCtrl+C(on Windows).Copy as Fetch—Converts the request as a Fetch code and puts it in the system clipboard.
Copy as cURL—Converts the request as a curl command and puts it in the system clipboard.
-
Copy as PowerShell—Converts the request as a Windows PowerShell code and puts it in the system clipboard.
The Copy as PowerShell feature generates Windows PowerShell code, not PowerShell (NetCore). These two PS variations use different APIs for HTTP requests (
WebRequestvs.HttpClient), making the generated code compatible only with Windows PowerShell. Copy as Python (Requests)—Converts the request as a Python code and puts it in the system clipboard.
Selecting
To select sessions directly related to the currently selected session, use the Select context menu option. You choose parent, children, and duplicate sessions.
Parent request—selects the session that is a parent of the currently selected session; can be accessed with the keyboard by pressing
P.Children requests—selects the sessions that are children of the currently selected session; can be accessed with the keyboard by pressing
C.Duplicate request—selects the session that is identical to the currently selected session; can be accessed with the keyboard by pressing
D.
Marking
Use the Mark context menu option to apply colors or strike out single or multiple sessions.
Select the sessions, open the context menu, and click the Mark option.
Click the preferred marking style to apply it.
Saved and shared sessions will contain the custom marking.
Comparing
Select two sessions and use the Compare context menu option to load the Compare Sessions tab.
Learn more on how to compare sessions with Fiddler Everywhere here...
Adding Sessions to Compare Groups
Add sessions to compare groups through the Add to compare groups. This functionality allows you to add and inspect more sessions in the Compare Sessions tab.
Learn more on how to work with compare groups here...
Commenting
To add comments on single or multiple sessions, use the Comment context menu option.
Select the sessions, open the context menu, and click the Comment option, which can be accessed with the keyboard by pressing
M.A Comment dialog appears. Enter the comment and click Ok.
The text is added to the comment field for the selected sessions.
Saved and shared sessions will contain the added comments.
Bypassing the Proxy
The Bypass option lets you quickly add a root domain or specific subdomain address to the bypass list on-the-fly while actively capturing. that the Fiddler Everywhere proxy will explicitly bypass. To add an endpoint to the bypass list:
Select the desired session entry.
-
Right-click to open the context menu. Then choose one of the following bypass options:
Select Bypass > Add <*.domain.xxx> to the bypass list to add the root domain and its subdomains to the bypass list. Adds a wildcard entry in the form **.domain.xxx*.
Select Bypass > Add
to the bypass list to add a specific domain address to the bypass list.
Consider the following rules when bypassing a domain:
- All endpoints added through Bypass option are part of the operating system bypass list until the Fiddler Everywhere proxy captures system traffic.
- All endpoints added through Bypass option will be explicitly bypassed when the Fiddler Everywhere proxy uses independent browser capturing.
- You can remove added endpoints from the bypass list through Bypass Fiddler for URLs that starts with.
- You can manually add more endpoints to the bypass list through Bypass Fiddler for URLs that starts with or through the Live Traffic context menu.
- Toggling off the Fiddler Everywhere system capturing removes Fiddler Everywhere as a system proxy and clears the operating system bypass list set by Fiddler Everywhere. Note that the Fiddler Everywhere bypass list (Bypass Fiddler for URLs that starts with) will remain unchanged and applicable for independent browser capturing.
- Closing the Fiddler Everywhere application resets the system proxy and clears the operating system bypass list set by Fiddler Everywhere. Note that the Fiddler Everywhere bypass list (Bypass Fiddler for URLs that starts with) will remain unchanged and applicable for independent browser capturing.
- The Bypass option is inactive and not applicable for HTTP CONNECT tunnels, and localhost addresses (for example, localhost, 127.0.0.1, ::1).