Qualitative Scale
This article describes the properties exposed by the control for adjusting the qualitative scale.
Setting Manual Range
The scale of the bulletgraph control auto calculates its range by default. To manually set the range of the scale use set the AutoRange property of the bulletgraph control to False and the Minimum and Maximum properties.
To control the interval between the ticks on the scale use the Step property.
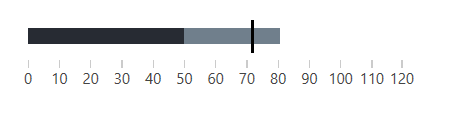
Example 1: Setting the scale range manually
<telerik:RadHorizontalBulletGraph AutoRange="False"
                                  Minimum="0"
                                  Maximum="120"
                                  Step="10"

                                  FeaturedMeasure="50"
                                  ComparativeMeasure="72"
                                  ProjectedValue="81"/>
Figure 1: Setting the scale range between 0 and 120
Hiding the Scale
To hide the scale's ticks and labels, set the QuantitativeScaleVisibility property.
Example 2: Hiding the scale
<telerik:RadHorizontalBulletGraph FeaturedMeasure="50"
                                  ComparativeMeasure="72"
                                  ProjectedValue="81"

                                  QuantitativeScaleVisibility="Hidden"/>
Figure 2: BulletGraph with hidden scale

Setting the visibility to Hidden and Collapsed leads to different visual results. When Collapsed, the control won't allocate the space for the scale, therefore the bar will be more wide. When the visibility is set to Hidden, the control will reserve space for the scale, therefore the bar won't stretch in all available space.
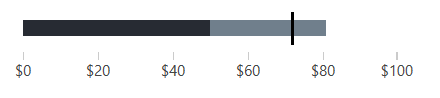
Formating the Labels
To format the tick labels displayed under the scale, use the TextFormatString property. The property allows you to set any of the standart numeric string format strings.
Example 3: Using currency format
<telerik:RadHorizontalBulletGraph FeaturedMeasure="50"
                                  ComparativeMeasure="72"
                                  ProjectedValue="81"

                                  TextFormatString="{}{0:C0}" />
Figure 3: Labels formatted using currency format
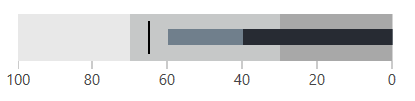
Inversing the Scale
To inverse the scale you can set the FlowDirection property of the control.
Example 4: Setting FlowDirection
<telerik:RadHorizontalBulletGraph FeaturedMeasure="40"
                                ComparativeMeasure="65"
                                ProjectedValue="60"

                                FlowDirection="RightToLeft">
    <telerik:RadHorizontalBulletGraph.QualitativeRanges>
        <telerik:QualitativeRange Brush="#A8A8A8" Value="30" />
        <telerik:QualitativeRange Brush="#C6C8C8" Value="70" />
        <telerik:QualitativeRange Brush="#E8E8E8" Value="100"/>
    </telerik:RadHorizontalBulletGraph.QualitativeRanges>
</telerik:RadHorizontalBulletGraph>
Figure 4: Inversed scale