WPF BulletGraph Overview
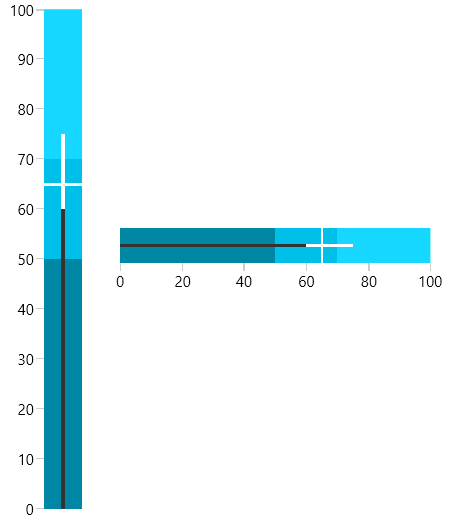
The RadBulletGraph control is a variation of linear gauge. It combines a number of indicators, as well as the data indicator into one control, which is lightweight, easily customizable and straightforward to setup and use. The control is a great tool for creating dashboards that presents a lot of information in relatively small size.
The RadBulletGraph is part of Telerik UI for WPF, a
professional grade UI library with 160+ components for building modern and feature-rich applications. To try it out sign up for a free 30-day trial.

Key Features
Various measurement features: Non zero-based scale, negative featured measures, projected values, multiple comparative measures and quantitative ranges.
Data Binding Support: The control can be easily data bound to your business data, either by setting its properties directly, or by using a binding declaration.
Get started with the control with its Getting Started help article that shows how to use it in a basic scenario.
Check out the online demo at demos.telerik.com
Telerik UI for WPF Support and Learning Resources
- Telerik UI for WPF BulletGraph Homepage
- Get Started with the Telerik UI for WPF BulletGraph
- Telerik UI for WPF API Reference
- Getting Started with Telerik UI for WPF Components
- Telerik UI for WPF Virtual Classroom (Training Courses for Registered Users)
- Telerik UI for WPF BulletGraph Forums
- Telerik UI for WPF Knowledge Base