Visual Structure
This article will help you understand the main concepts used in the scope of the RadSparkline controls.
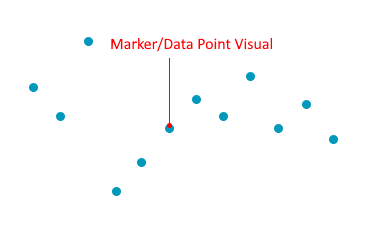
Marker/Data Point Visual: A visual element presenting the associated data item from the ItemsSource of the RadLinearSparkline, RadAreaSparkline and RadScatterSparkline controls.
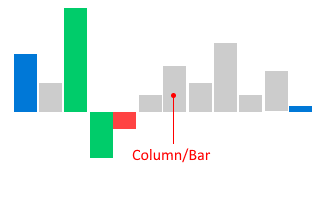
Column/Bar: A visual element presenting the associated data item from the ItemsSource of the RadColumnSparkline and RadWinLossSparkline controls.
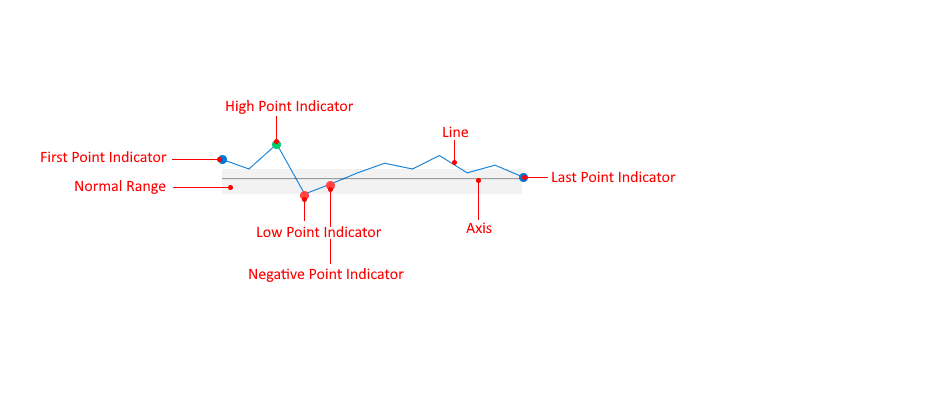
Line: The line formed by the data items in the ItemsSource of the RadLinearSparkline and RadAreaSparkline controls.
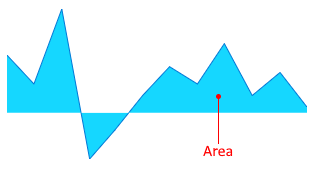
Area: The area formed by the data items in the ItemsSource of the RadAreaSparkline control.
Axis: A horizontal axis that marks a point on the vertical (Y) axis.
First Point Indicator: A marker displayed for the first data item.
Last Point Indicator: A marker displayed for the last data item.
High Point Indicator: A marker displayed for the data item with the biggest value on the vertical (Y) axis.
Low Point Indicator: A marker displayed for the data item with the lowest value on the vertical (Y) axis.
Negative Point Indicator: Markers displayed for the data items with negative values on the vertical (Y) axis.
Normal Range: A rectangular area between two points on the vertical (Y) axis that annotates a range on the axis.