Label Strategy
When you want to fully customize the labels of your chart, you can use a label strategy to override the labels' appearance, content and layout.
Properties
In order to use a label strategy you have to create a class inheriting from ChartSeriesLabelStrategy, specify the LabelStrategyOptions you wish to customize and override their corresponding methods. The available options are:
DefaultVisual: The strategy will provide a custom visual element for each label. You have to override the CreateDefaultVisual method.
Measure: The strategy will provide custom measurement logic for each label. You have to override the GetLabelDesiredSize method.
Content: The strategy will provide custom content for each label. You have to override the GetLabelContent method. You can also override the SetLabelContent method used for UI virtualization and allows for reusing label content when panning and zooming.
Arrange: The strategy will provide custom arrange logic for each label. You have to override the GetLabelLayoutSlot method.
Example
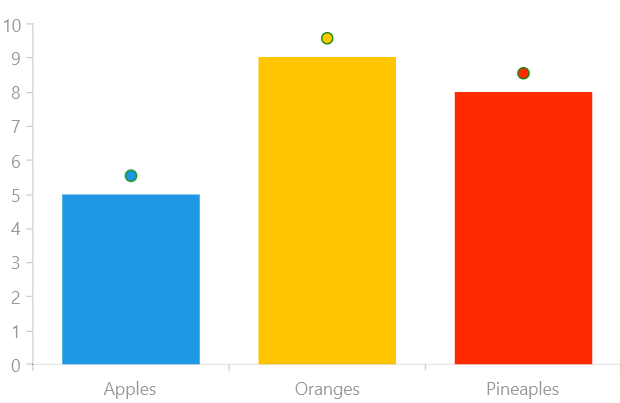
Examples 1, 2 and 3 will show how the default visual of the labels can be customized.
Example 1: Defining the BarLabelStrategy
public class BarLabelStrategy : ChartSeriesLabelStrategy
{
    private readonly LabelStrategyOptions options = LabelStrategyOptions.DefaultVisual | LabelStrategyOptions.Measure;

    public override LabelStrategyOptions Options
    {
        get
        {
            return this.options;
        }
    }

    public override FrameworkElement CreateDefaultVisual(DataPoint point, int labelIndex)
    {
        var series = point.Presenter as ChartSeries;

        return new Ellipse()
        {
            Stroke = new SolidColorBrush(Colors.Green),
            Fill = series.Chart.Palette.GetBrush(point.CollectionIndex, PaletteVisualPart.Fill)
        };
    }

    public override RadSize GetLabelDesiredSize(DataPoint point, FrameworkElement visual, int labelIndex)
    {
        return new RadSize(10, 10);
    }
}
If you use elements that do not have a desired size you have to override the GetLabelDesiredSize method.
Example 2: Declaring the RadCartesianChart and BarSeries
<Grid xmlns:telerikChart="using:Telerik.UI.Xaml.Controls.Chart">
    <telerikChart:RadCartesianChart x:Name="barSeries" PaletteName="DefaultLight">
        <telerikChart:RadCartesianChart.VerticalAxis>
            <telerikChart:LinearAxis/>
        </telerikChart:RadCartesianChart.VerticalAxis>
        <telerikChart:RadCartesianChart.HorizontalAxis>
            <telerikChart:CategoricalAxis/>
        </telerikChart:RadCartesianChart.HorizontalAxis>

        <telerikChart:BarSeries ItemsSource="{Binding}" PaletteMode="DataPoint" ShowLabels="True">
            <telerikChart:BarSeries.LabelDefinitions>
                <telerikChart:ChartSeriesLabelDefinition HorizontalAlignment="Center" Margin="0,0,0,10" >
                    <telerikChart:ChartSeriesLabelDefinition.Strategy>
                        <local:BarLabelStrategy/>
                    </telerikChart:ChartSeriesLabelDefinition.Strategy>
                </telerikChart:ChartSeriesLabelDefinition>
            </telerikChart:BarSeries.LabelDefinitions>

            <telerikChart:BarSeries.CategoryBinding>
                <telerikChart:PropertyNameDataPointBinding PropertyName="Category"/>
            </telerikChart:BarSeries.CategoryBinding>
            <telerikChart:BarSeries.ValueBinding>
                <telerikChart:PropertyNameDataPointBinding PropertyName="Value"/>
            </telerikChart:BarSeries.ValueBinding>
        </telerikChart:BarSeries>
    </telerikChart:RadCartesianChart>
</Grid>
Example 3: Populating with data
public class Data
{
    public string Category { get; set; }

    public double Value { get; set; }
}

public sealed partial class MainPage : Page
{
    public MainPage()
    {
        this.InitializeComponent();

        List<Data> data = new List<Data>();
        data.Add(new Data() { Category = "Apples", Value = 5 });
        data.Add(new Data() { Category = "Oranges", Value = 9 });
        data.Add(new Data() { Category = "Pineaples", Value = 8 });

        this.barSeries.DataContext = data;
    }
}
Figure 1: BarSeries with custom labels