Using Series Provider
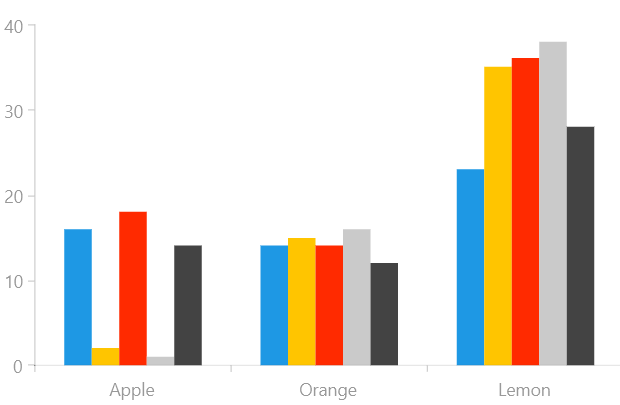
This topic demonstrates how to use the ChartSeriesProvider to generate series dynamically.
At the end of the tutorial you will see a result similar to the following:
Using Collection of Series View Models
This example shows how to bind the Source property of the series provider to a collection of view model describing the chart series.
Defining the model and viewmodel
    public class DataPointModel
    {
        public double Value { get; set; }
        public string Category { get; set; }
    }

    public class SeriesModel
    {
        public List<DataPointModel> GetData { get; set; }
    }
Populating with data
public partial class MainPage : Page
{
    private static Random r = new Random(0);

    public MainPage()
    {
        this.InitializeComponent();
        this.provider.Source = GenerateSeriesModels();
    }

    public List<DataPointModel> GenerateDataPointModels()
    {
        List<DataPointModel> data = new List<DataPointModel>();
        data.Add(new DataPointModel { Category = "Apple", Value = r.Next(1, 20) });
        data.Add(new DataPointModel { Category = "Orange", Value = r.Next(10, 30) });
        data.Add(new DataPointModel { Category = "Lemon", Value = r.Next(20, 40) });
        return data;
    }

    public List<SeriesModel> GenerateSeriesModels()
    {
        List<SeriesModel> collection = new List<SeriesModel>();
        for (int i = 0; i < 5; i++)
        {
            SeriesModel vm = new SeriesModel();
            vm.GetData = GenerateDataPointModels();
            collection.Add(vm);
        }
        return collection;
    }
}
Defining the model
<Grid xmlns:telerikChart="using:Telerik.UI.Xaml.Controls.Chart">
    <telerikChart:RadCartesianChart PaletteName="DefaultDark" >
        <telerikChart:RadCartesianChart.HorizontalAxis>
            <telerikChart:CategoricalAxis/>
        </telerikChart:RadCartesianChart.HorizontalAxis>
        <telerikChart:RadCartesianChart.VerticalAxis>
            <telerikChart:LinearAxis/>
        </telerikChart:RadCartesianChart.VerticalAxis>
        <telerikChart:RadCartesianChart.SeriesProvider >
            <telerikChart:ChartSeriesProvider x:Name="provider">
                <telerikChart:ChartSeriesProvider.SeriesDescriptors>
                    <telerikChart:CategoricalSeriesDescriptor ItemsSourcePath="GetData" ValuePath="Value" CategoryPath="Category">
                        <telerikChart:CategoricalSeriesDescriptor.Style>
                            <Style TargetType="telerikChart:BarSeries">
                                <Setter Property="CombineMode" Value="Cluster"/>
                            </Style>
                        </telerikChart:CategoricalSeriesDescriptor.Style>
                    </telerikChart:CategoricalSeriesDescriptor>
                </telerikChart:ChartSeriesProvider.SeriesDescriptors>
            </telerikChart:ChartSeriesProvider>
        </telerikChart:RadCartesianChart.SeriesProvider>
    </telerikChart:RadCartesianChart>
</Grid>
Using Collection of Collections
This example shows how to create a collection containing collections of data point view models. The parent collection is bound to the Source of the series provider. For each child collection a new chart series is created and the collection items are used to generate chart data points.
Defining the model
public class DataPointModel
{
    public double Value { get; set; }
    public string Category { get; set; }
}
Populating with data
private static Random r = new Random(0);

public MainPage()
{
    this.InitializeComponent();
    List<List<DataPointModel>> collection = new List<List<DataPointModel>>();
    for (int i = 0; i < 5; i++)
    {
        List<DataPointModel> data = new List<DataPointModel>();
        data.Add(new DataPointModel { Category = "Apple", Value = r.Next(1, 20) });
        data.Add(new DataPointModel { Category = "Orange", Value = r.Next(1, 20) });
        data.Add(new DataPointModel { Category = "Lemon", Value = r.Next(1, 20) });
        collection.Add(data);
    }
    provider.Source = collection;

}
Defining the RadCartesianChart and the ChartSeriesProvider
<telerikChart:RadCartesianChart PaletteName="DefaultDark" >
    <telerikChart:RadCartesianChart.HorizontalAxis>
        <telerikChart:CategoricalAxis/>
    </telerikChart:RadCartesianChart.HorizontalAxis>
    <telerikChart:RadCartesianChart.VerticalAxis>
        <telerikChart:LinearAxis/>
    </telerikChart:RadCartesianChart.VerticalAxis>
    <telerikChart:RadCartesianChart.SeriesProvider >
        <telerikChart:ChartSeriesProvider x:Name="provider" >
            <telerikChart:ChartSeriesProvider.SeriesDescriptors>
                <telerikChart:CategoricalSeriesDescriptor ValuePath="Value" CategoryPath="Category">
                    <telerikChart:CategoricalSeriesDescriptor.Style>
                        <Style TargetType="telerikChart:BarSeries">
                            <Setter Property="CombineMode" Value="Cluster"/>
                        </Style>
                    </telerikChart:CategoricalSeriesDescriptor.Style>
                </telerikChart:CategoricalSeriesDescriptor>
            </telerikChart:ChartSeriesProvider.SeriesDescriptors>
        </telerikChart:ChartSeriesProvider>
    </telerikChart:RadCartesianChart.SeriesProvider>
</telerikChart:RadCartesianChart>