Multiple Axes
RadChart supports multiple axes. You can add vertical and horizontal axes on a per chart basis and per series basis. This means that if you have two series in one chart instance, you can use different horizontal and vertical axes for each series. Additionally, you can control their position through the VerticalLocation and HorizontalLocation properties, respectively, for HorizontalAxis and VerticalAxis.
Example
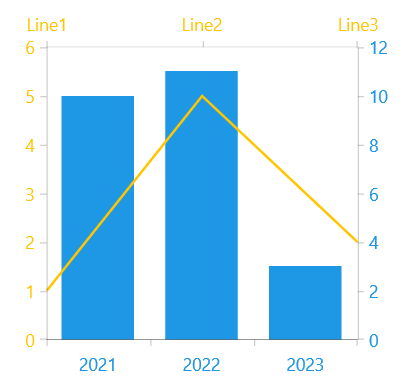
Examples 1 and 2 demonstrate a scenario in which we have two series - LineSeries and BarSeries. We will use a CategoricalAxis positioned on the Top and a LinearAxis on the Left for the LineSeries. For the BarSeries we will use a DateTimeCategoricalAxis positioned at the Bottom and a LinearAxis on the Right.
Example 1: Multiple Axes
<Grid xmlns:telerikChart="using:Telerik.UI.Xaml.Controls.Chart"
      xmlns:telerikCharting="using:Telerik.Charting">
    <telerikChart:RadCartesianChart PaletteName="DefaultDark" Width="300" Height="300">
        <telerikChart:RadCartesianChart.DataContext>
            <local:ViewModel/>
        </telerikChart:RadCartesianChart.DataContext>
        <telerikChart:BarSeries ItemsSource="{Binding Data}">
            <telerikChart:BarSeries.HorizontalAxis>
                <telerikChart:DateTimeCategoricalAxis VerticalLocation="Bottom"
                                                  Foreground="#1E98E4"
                                                  LabelFormat="{}{0,0:yyyy}"/>
            </telerikChart:BarSeries.HorizontalAxis>
            <telerikChart:BarSeries.VerticalAxis>
                <telerikChart:LinearAxis HorizontalLocation="Right" Foreground="#1E98E4"/>
            </telerikChart:BarSeries.VerticalAxis>
            <telerikChart:BarSeries.CategoryBinding>
                <telerikChart:PropertyNameDataPointBinding PropertyName="BarCategory"/>
            </telerikChart:BarSeries.CategoryBinding>
            <telerikChart:BarSeries.ValueBinding>
                <telerikChart:PropertyNameDataPointBinding PropertyName="BarValue"/>
            </telerikChart:BarSeries.ValueBinding>
        </telerikChart:BarSeries>

        <telerikChart:LineSeries ItemsSource="{Binding Data}">
            <telerikChart:LineSeries.HorizontalAxis>
                <telerikChart:CategoricalAxis VerticalLocation="Top" Foreground="#FFC500"/>
            </telerikChart:LineSeries.HorizontalAxis>
            <telerikChart:LineSeries.VerticalAxis>
                <telerikChart:LinearAxis HorizontalLocation="Left" Foreground="#FFC500"/>
            </telerikChart:LineSeries.VerticalAxis>
            <telerikChart:LineSeries.CategoryBinding>
                <telerikChart:PropertyNameDataPointBinding PropertyName="LineCategory"/>
            </telerikChart:LineSeries.CategoryBinding>
            <telerikChart:LineSeries.ValueBinding>
                <telerikChart:PropertyNameDataPointBinding PropertyName="LineValue"/>
            </telerikChart:LineSeries.ValueBinding>
            <telerikChart:LineSeries.PointTemplate>
                <DataTemplate>
                    <Ellipse Width="20" Height="20"/>
                </DataTemplate>
            </telerikChart:LineSeries.PointTemplate>
        </telerikChart:LineSeries>
    </telerikChart:RadCartesianChart>
</Grid>
Example 2: Model and ViewModel
public class Data
{
    public string LineCategory { get; set; }

    public DateTime BarCategory { get; set; }

    public double LineValue { get; set; }

    public double BarValue { get; set; }
}

public class ViewModel
{
    public ObservableCollection<Data> Data
    {
        get
        {
            ObservableCollection<Data> collection = new ObservableCollection<Data>();
            collection.Add(new Data { LineCategory = "Line1", LineValue = 1, BarCategory = DateTime.Now.AddYears(1), BarValue = 10 });
            collection.Add(new Data { LineCategory = "Line2", LineValue = 5, BarCategory = DateTime.Now.AddYears(2), BarValue = 11 });
            collection.Add(new Data { LineCategory = "Line3", LineValue = 2, BarCategory = DateTime.Now.AddYears(3), BarValue = 3 });
            return collection;
        }
    }
}
Figure 1: RadCartesianChart with multiple axes