Connections
This tutorial will walk you through the functionality and the main features of the RadDiagramConnection. It contains the following sections:
- Overview
- Configure the Source and Target of a Connection
- Connection Types
- CapTypes
- Connection Content
- Customize the Connection Appearance
- Connection Edit Mode
- Connection Bridges
- Connection Selection State
- Connection ZIndex
- Connection Bounds
- Use Free Connectors
- Custom Connection
Before proceeding with this topic, it is recommended to get familiar with the Visual Structure of the Diagramming Framework.
Overview
Please note that the examples in this tutorial are showcasing Telerik Windows8 theme. In the Setting a Theme article you can find more information on how to set an application-wide theme.
The RadDiagramConnection is basically an object that connects zero, one or two shapes:
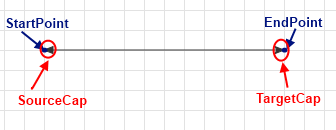
You can use its extensive API to configure its source and target points or shapes. You can choose from a list of predefined cap types thus customizing the start and end point of the connection to better fit in your application scenario. You can also control the type of a connection using the ConnectionType property, add a custom content and customize the overall look and feel of the items.
Configure the Source and Target of a Connection
You can configure the source and the target of a connection as a point or as a shape. The RadDiagramConnection class exposes the following properties that allow you to control the start and end points of a connection:
StartPoint/EndPoint: These properties are of type Point and they set or get the start/end point of a connection.
Source/Target: These properties get or set the source/target RadDiagramShape of a connection.
-
SourceConnectorPosition/TargetConnectorPosition: Both properties are of type string and they get or set the source/target connector position.
You can find more information about the RadDiagramShape connectors in the DiagramShapes topic.
There are five predefined strings that you can use to define where to position the connectors of the connection:
Auto: Use it if you want to automatically determine the start/end point of a connection. This option will allow the connection to dynamically determine which shape connector to be used as a start/end point. Based on the end point position, the SourceConnectorPosition will be set to the nearest shape connector. Alternatively, the TargetConnectorPosition will be set to the nearest shape connector, based on the start point position of the connection.
Left: Use it to define the left connector of a shape as the source/target point of the connection
Top: Use it to define the top connector of a shape as the source/target point of the connection
Right: Use it to define the right connector of a shape as the source/target point of the connection
Bottom: Use it to define the bottom connector of a shape as the source/target point of the connection
The Diagramming Framework provides a ConnectorPosition static class, which you can use to define the connector positions from code-behind:
using Telerik.Windows.Diagrams.Core;this.xDiagram.Connections[0].SourceConnectorPosition = ConnectorPosition.Bottom; SourceCapSize/TargetCapSize - these properties are of type Size and they get or set the size of the SourceCap/TargetCap.
SourceCapType/TargetCapType - both properties are an enumeration of type CapType that allow you to choose a cap from a set of predefined Cap types. For more detailed information, please, view the CapTypes section below.
You can also attach a connection to a source and target shape using the RadDiagramConnection.Attach() method. It defines the following parameters:
source of type IConnector: Required parameter that sets the Source of the connection.
target of type IConnector: Required parameter that sets the Target of the connection.
Connection Types
You can control the connection type through the ConnectionType property. As an enumeration of type Telerik.Windows.Diagrams.Core.ConnectionType, it exposes the following members:
-
Polyline: This connection type allows you to define multiple points, a connection has to pass through. By default such a connection have two points it has to pass through - its source connector (or StartPoint) and its target connector (or EndPoint). This is why by default the Polyline ConnectionType visualizes a straight connection.
Example 1:Polyline Connection
    <Grid>
        <telerik:RadDiagram>
            <telerik:RadDiagramShape x:Name="xShape1" Content="Shape1"  Geometry="{telerik:FlowChartShape ShapeType=Database1Shape}" Position="250,100" />
            <telerik:RadDiagramShape x:Name="xShape4" Content="Shape4" Geometry="{telerik:FlowChartShape ShapeType=Database2Shape}" Position="600,400" />

            <telerik:RadDiagramConnection Source="{Binding ElementName=xShape1}" Target="{Binding ElementName=xShape4}" ConnectionType="Polyline" />
        </telerik:RadDiagram>
    </Grid>
Sample of a straight Polyline connection between two shapes:
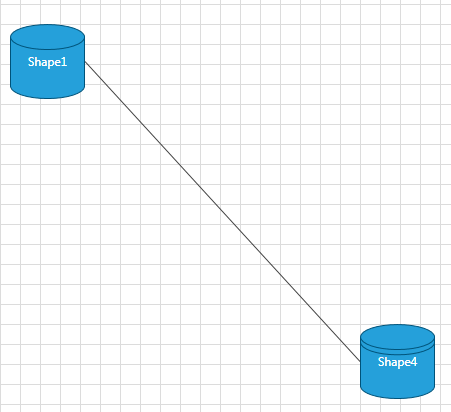
If you want to change the route of the connection, you can add connection points in runtime while pressing the Ctrl key and using the mouse to place points on the connection. You can move each point around the diagramming surface to create a curved connection. You can also explicitly define the connection points in code-behind through the RadDiagramConnection.ConnectionPoints property. You can populate the ConnectionPoints collection with objects of type Point:
Example 2: Add ConnectionPoints
    <telerik:RadDiagram>
        <telerik:RadDiagramShape x:Name="xShape1"
                                    Content="Shape1"
                                    Geometry="{telerik:FlowChartShape ShapeType=Database1Shape}"
                                    Position="250,100" />
        <telerik:RadDiagramShape x:Name="xShape4"
                                    Content="Shape4"
                                    Geometry="{telerik:FlowChartShape ShapeType=Database2Shape}"
                                    Position="400,300" />

        <telerik:RadDiagramConnection x:Name="xConnection"
                                        ConnectionType="Polyline"
                                        Source="{Binding ElementName=xShape1}"
                                        Target="{Binding ElementName=xShape4}" />
    </telerik:RadDiagram>
Example 3: Add ConnectionPoints
    xConnection.ConnectionPoints.Add(new Point(300, 140));
    xConnection.ConnectionPoints.Add(new Point(420, 200));
    xConnection.ConnectionPoints.Add(new Point(440, 300));
xConnection.ConnectionPoints.Add(New Point(300, 140)) xConnection.ConnectionPoints.Add(New Point(420, 200)) xConnection.ConnectionPoints.Add(New Point(440, 300))Sample of a curved Polyline connection:
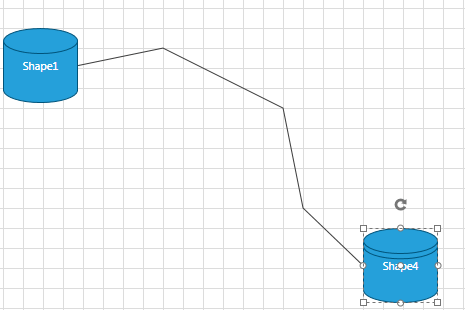
You can use a default routing algorithm to automatically create connection points and route your connections. This basically ensures that the diagramming framework will use a routing algorithm to make sure that the path of the connection won't collide with any shapes. In order to use this feature, you can set the RadDiagram RouteConnections property to True. Please refer to the Routing tutorial for more information on the routing algorithm. If you want to use a rounded polyline connection, you can set the RadDiagram ConnectionRoundedCorners to True.
Example 4: Add rounded corners
    <telerik:RadDiagram x:Name="xDiagram" ConnectionRoundedCorners="True">
        <telerik:RadDiagramShape x:Name="xShape1"
                                 Content="Shape1"
                                 Geometry="{telerik:FlowChartShape ShapeType=Database1Shape}"
                                 Position="240,260" />
        <telerik:RadDiagramShape x:Name="xShape2"
                                 Content="Shape2"
                                 Geometry="{telerik:FlowChartShape ShapeType=DataStoreShape}"
                                 GlidingStyle="Rectangle"
                                 Position="600,80"
                                 UseGlidingConnector="True" />
        <telerik:RadDiagramShape x:Name="xShape3"
                                 Content="Shape3"
                                 Geometry="{telerik:FlowChartShape ShapeType=DataStoreShape}"
                                 Position="600,380" />
        <telerik:RadDiagramConnection ConnectionType="Polyline"
                                      Source="{Binding ElementName=xShape1}"
                                      SourceConnectorPosition="Top"
                                      Target="{Binding ElementName=xShape2}"/>
        <telerik:RadDiagramConnection ConnectionType="Polyline"
                                      Source="{Binding ElementName=xShape1}"
                                      SourceConnectorPosition="Bottom"
                                      Target="{Binding ElementName=xShape3}" />

    </telerik:RadDiagram>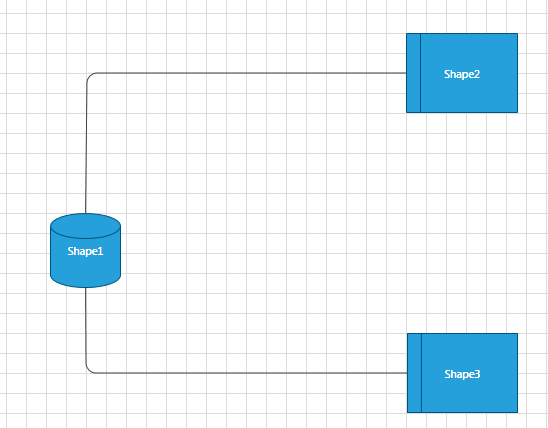
Please note that in the above example the ConnectionPoints of the connections are added in runtime using the Ctrl key and the mouse.
-
Bezier: This connection type allows you to create a Bézier curve. The Bezier connection is a curve specified by four points: two end points (p1 and p2) - the source/start and target/end of the connection and two handle points (h1 and h2) and a tension parameter. The curve begins at p1 and ends at p2 and it doesn't pass through the handle points, but the handle points act as magnets, pulling the curve in certain directions and influencing the way the curve bends. The following illustration shows a Bézier RadDiagramConnection along with its endpoints and handle points.
Illustration of a Bezier connection definition points:
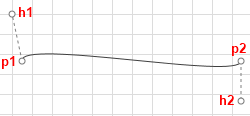
The RadDiagramConnection.BezierTension parameter defines the curve that will be produced for a given set of end and handle points. The following illustration shows four Bezier connections defined by the same set of end and handle points:
Example 5: Bezier Connection Type
    <telerik:RadDiagram x:Name="xDiagram" Margin="50">
        <telerik:RadDiagramShape x:Name="xShape1"
                            Content="Shape1"
                            Geometry="{telerik:FlowChartShape ShapeType=Database1Shape}"
                            Position="50,50" />
        <telerik:RadDiagramShape x:Name="xShape2"
                            Content="Shape2"
                            Geometry="{telerik:FlowChartShape ShapeType=DataStoreShape}"
                            Position="450,100" />
        <telerik:RadDiagramConnection ConnectionType="Bezier" BezierTension="3"
                                Source="{Binding ElementName=xShape1}"
                                Target="{Binding ElementName=xShape2}" Stroke="Red"/>
        <telerik:RadDiagramConnection ConnectionType="Bezier" BezierTension="9"
                                Source="{Binding ElementName=xShape1}"
                                Target="{Binding ElementName=xShape2}" Stroke="Blue"/>
        <telerik:RadDiagramConnection ConnectionType="Bezier" BezierTension="16"
                                Source="{Binding ElementName=xShape1}"
                                Target="{Binding ElementName=xShape2}" Stroke="Green"/>
    </telerik:RadDiagram>
Illustration of a Bezier connection tension parameter:

By default when you create a Bezier connection and attach its endpoints to RadDiagramShapes, the position of the handle points of the connection will be calculated based on the connector positions. Both handle points will be added to the RadDiagramConnection.ConnectionPoints collection. The following snapshot illustrates the default direction of the Bezier connection handles based on the position of the connector to which the connection is attached.
Illustration of a Bezier connection default handle points directions:
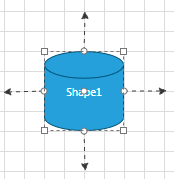
The offset between a Bezier connection handle point and its corresponding endpoint is controlled thorough the BezierAutoOffset DiagramConstants. Its default value is 30px, but you can change it to better fit your needs:
Example 6: Set Bezier Offset
DiagramConstants.BezierAutoOffset = 40;DiagramConstants.BezierAutoOffset = 40When attaching a Bezier connection to a RadDiagramShape you need to consider if it is attached to a built-in connector or to a custom connector. If the connection is attached to a custom connector, then you will have to manually set the position of the Bezier handle points. You can change the position of the points after you access them from the RadDiagramConnection.ConnectionPoints collection, but you will also have to set the RadDiagramConnection.IsModified property to True to apply the changes:
Example 7: Add ConnectionPoints to Bezier connection type
    this.xDiagram.Connections[0].ConnectionPoints[0] = new Point(100, 100);
    this.xDiagram.Connections[0].ConnectionPoints[1] = new Point(220, 200);
    this.xDiagram.Connections[0].IsModified = true;
Me.xDiagram.Connections(0).ConnectionPoints(0) = New Point(100, 100) Me.xDiagram.Connections(0).ConnectionPoints(1) = New Point(220, 200) Me.xDiagram.Connections(0).IsModified = TrueIf you don't want to manually traverse the ConnectionPoints collection and then set the IsModified property, you can use the RadDiagramConnection.SetBezierHandles(Point,Point) method. It facilitates the definition of custom coordinates for the two handle points of a Bezier connection:
Example 8: Using SetBezierHandles() method
(this.xDiagram.Connections[0] as RadDiagramConnection).SetBezierHandles(new Point(100, 100), new Point(220, 200));TryCast(Me.xDiagram.Connections(0), RadDiagramConnection).SetBezierHandles(New Point(100, 100), New Point(220, 200))Please note that if you create custom connectors which names include any of the following strings:
- „right“
- “left”
- “bottom”
- “up” the Bezier Connection handle points will point at the direction indicated by the respective string.
On the other hand, if you attach a Bezier Connection to a custom connector which name doesn't indicate a direction, the handle points of the connection will match the start and end point of the connection.
-
Spline: This connection type represents a cardinal spline. The connection is specified by an array of points - the connection passes smoothly through each point in the array; there are no sharp corners and no abrupt changes in the tightness of the curve. The following illustration shows a set of points and a spline connection that passes through each point in the set.
Sample of a Spline connection:
 In order to set the array of points, you will have to populate the RadDiagram.ConnectionPoints collection. You can do that manually in code-behind:
 Example 9: Spline Connection Type
    <telerik:RadDiagram x:Name="xDiagram" >
        <telerik:RadDiagramShape x:Name="xShape1"
                                Content="Shape1"
                                Geometry="{telerik:FlowChartShape ShapeType=Database1Shape}"
                                Position="0,0" />
        <telerik:RadDiagramShape x:Name="xShape2"
                                Content="Shape2"
                                Geometry="{telerik:FlowChartShape ShapeType=DataStoreShape}"
                                Position="450,100" />
        <telerik:RadDiagramConnection ConnectionType="Spline"
                                      Source="{Binding ElementName=xShape1}"
                                      Target="{Binding ElementName=xShape2}" />
    </telerik:RadDiagram>
Example 10: Add ConnectionPoints to Spline Connection
    this.xDiagram.Connections[0].ConnectionPoints.Add(new Point(140, 20));
    this.xDiagram.Connections[0].ConnectionPoints.Add(new Point(250, 150));
    this.xDiagram.Connections[0].ConnectionPoints.Add(new Point(350, 50));
Me.xDiagram.Connections(0).ConnectionPoints.Add(New Point(140, 20)) Me.xDiagram.Connections(0).ConnectionPoints.Add(New Point(250, 150)) Me.xDiagram.Connections(0).ConnectionPoints.Add(New Point(350, 50))
CapTypes
-
CapTypes enumeration members:
None:

Example 11: None Cap Type
<telerik:RadDiagramConnection SourceCapType="None" TargetCapType="None" StartPoint="10,360" EndPoint="80,360" />Arrow1:

Example 12: Arrow1 Cap Type
    <telerik:RadDiagramConnection
        SourceCapType="Arrow1"
        TargetCapType="Arrow1"
        StartPoint="10,30"
        EndPoint="80,30" />
Arrow1Filled_

Example 13: Arrow1Filled Cap Type
    <telerik:RadDiagramConnection
        SourceCapType="Arrow1Filled"
        TargetCapType="Arrow1Filled"
        StartPoint="10,60"
        EndPoint="80,60" />
Arrow2

Example 14: Arrow2 Cap Type
    <telerik:RadDiagramConnection
        SourceCapType="Arrow2"
        TargetCapType="Arrow2"
        StartPoint="10,90"
        EndPoint="80,90" />
Arrow2Filled

Example 15: Arrow2Filled Cap Type
    <telerik:RadDiagramConnection
        SourceCapType="Arrow2Filled"
        TargetCapType="Arrow2Filled"
        StartPoint="10,120"
        EndPoint="80,120" />
Arrow3

Example 16: Arrow3 Cap Type
    <telerik:RadDiagramConnection
        SourceCapType="Arrow3"
        TargetCapType="Arrow3"
        StartPoint="10,150"
        EndPoint="80,150" />
Arrow4

Example 17: Arrow4 Cap Type
    <telerik:RadDiagramConnection
        SourceCapType="Arrow4"
        TargetCapType="Arrow4"
        StartPoint="10,180"
        EndPoint="80,180" />
Arrow4Filled

Example 18: Arrow4Filled Cap Type
    <telerik:RadDiagramConnection
        SourceCapType="Arrow4Filled"
        TargetCapType="Arrow4Filled"
        StartPoint="10,210"
        EndPoint="80,210" />
Arrow5

Example 19: Arrow5 Cap Type
    <telerik:RadDiagramConnection
        SourceCapType="Arrow5"
        TargetCapType="Arrow5"
        StartPoint="10,240"
        EndPoint="80,240" />
Arrow5Filled

Example 20: Arrow5Filled Cap Type
    <telerik:RadDiagramConnection
        SourceCapType="Arrow5Filled"
        TargetCapType="Arrow5Filled"
        StartPoint="10,270"
        EndPoint="80,270" />
Arrow6

Example 21: Arrow6 Cap Type
    <telerik:RadDiagramConnection
        SourceCapType="Arrow6"
        TargetCapType="Arrow6"
        StartPoint="10,300"
        EndPoint="80,300" />
Arrow6Filled

Example 22: Arrow6Filled Cap Type
    <telerik:RadDiagramConnection
        SourceCapType="Arrow6Filled"
        TargetCapType="Arrow6Filled"
        StartPoint="10,330"
        EndPoint="80,330" />
Set Content
You can label a connection by setting its Content property. The Content property can define a string, a UIElement or it can be bound to a business property.
-
Label a connection with a sample string:
Example 23: Set Connection Content
    <Grid>
        <telerik:RadDiagram>
            <telerik:RadDiagramShape
                x:Name="ConditionShape"
                Width="80"
                Height="80"
                Content="condition"
                FontWeight="Bold"
                Geometry="{telerik:FlowChartShape ShapeType=DecisionShape}"
                Position="160,80" />
            <telerik:RadDiagramShape
                x:Name="StatementShape1"
                Width="100"
                Content="statement(s)"
                FontWeight="Bold"
                Position="60,280" />
            <telerik:RadDiagramConnection
                Content="if condition is false"
                FontWeight="Bold"
                Source="{Binding ElementName=ConditionShape}"
                SourceConnectorPosition="Bottom"
                StrokeThickness="2"
                Target="{Binding ElementName=StatementShape1}"
                TargetCapType="Arrow1Filled" />
        </telerik:RadDiagram>
    </Grid>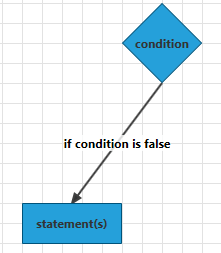
-
Define UIElements in the Content of the connection:
Example 24: Custom elements inside Connection Content
    <Grid>
        <telerik:RadDiagram>
            <telerik:RadDiagramShape x:Name="ConditionShape"
                                     Width="80"
                                     Height="80"
                                     Content="condition"
                                     FontWeight="Bold"
                                     Geometry="{telerik:FlowChartShape ShapeType=DecisionShape}"
                                     Position="160,80" />
            <telerik:RadDiagramShape x:Name="StatementShape1"
                                     Width="100"
                                     Content="statement(s)"
                                     FontWeight="Bold"
                                     Position="60,280" />
            <telerik:RadDiagramConnection FontWeight="Bold"
                                          Source="{Binding ElementName=ConditionShape}"
                                          SourceConnectorPosition="Bottom"
                                          StrokeThickness="2"
                                          Target="{Binding ElementName=StatementShape1}"
                                          TargetCapType="Arrow1Filled">
                <telerik:RadDiagramConnection.Content>
                    <Grid>
                        <Grid.RowDefinitions>
                            <RowDefinition />
                            <RowDefinition />
                            <RowDefinition />
                        </Grid.RowDefinitions>
                        <StackPanel Margin="3" Orientation="Horizontal">
                            <TextBlock Text="StrokeThickness: " />
                            <TextBlock Text="{Binding RelativeSource={RelativeSource AncestorType=telerik:RadDiagramConnection}, Path=StrokeThickness}" />
                        </StackPanel>
                        <StackPanel Grid.Row="1"
                                    Margin="3"
                                    Orientation="Horizontal">
                            <TextBlock Text="StartPoint: " />
                            <TextBlock Margin="0,0,4,0" Text="{Binding RelativeSource={RelativeSource AncestorType=telerik:RadDiagramConnection}, Path=StartPoint}" />
                        </StackPanel>
                        <StackPanel Grid.Row="2"
                                    Margin="3"
                                    Orientation="Horizontal">
                            <TextBlock Text="EndPoint: " />
                            <TextBlock Text="{Binding RelativeSource={RelativeSource AncestorType=telerik:RadDiagramConnection}, Path=EndPoint}" />
                        </StackPanel>
                    </Grid>
                </telerik:RadDiagramConnection.Content>
            </telerik:RadDiagramConnection>
        </telerik:RadDiagram>
    </Grid>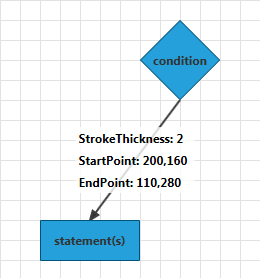
-
Bind the Content to a business property: For the purpose of this tutorial, let's define a sample business class and set it as the DataContext of the UserControl.
Example 25: Create business object
     public class DataItem : ViewModelBase
        {
            private string ipAddress;
            public string IpAddress
            {
                get { return ipAddress; }
                set
                {
                    ipAddress = value;
                    this.OnPropertyChanged("IpAddress");
                }
            }
        }
        ....
    this.DataContext = new DataItem() { IpAddress = "192.168.92.0" };
Public Class DataItem Inherits ViewModelBase Private m_ipAddress As String Public Property IpAddress() As String Get Return m_ipAddress End Get Set m_ipAddress = value Me.OnPropertyChanged("IpAddress") End Set End Property End Class ... Me.DataContext = New DataItem() With { .IpAddress = "192.168.92.0" }Example 25: Bind Connection Content property
    <Grid>
        <telerik:RadDiagram>
            <telerik:RadDiagramShape x:Name="ConditionShape"
                                     Height="30"
                                     Content="Router"
                                     FontWeight="Bold"
                                     Geometry="{telerik:FlowChartShape ShapeType=Database1Shape}"
                                     Position="80,80" />
            <telerik:RadDiagramShape x:Name="StatementShape1"
                                     Content="PC 1"
                                     FontWeight="Bold"
                                     Position="120,220" />
            <telerik:RadDiagramConnection VerticalContentAlignment="Top"
                                          Content="{Binding IpAddress}"
                                          FontWeight="Bold"
                                          Source="{Binding ElementName=ConditionShape}"
                                          Target="{Binding ElementName=StatementShape1}"
                                          TargetCapType="Arrow1Filled" />
        </telerik:RadDiagram>
    </Grid>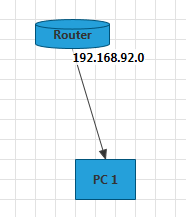
-
If you want to customize the visual representation of the bound property, you can take advantage of the RadDiagramConnection ContentTemplate property:
Example 26: Set ContentTemplate
    <Grid>
        <telerik:RadDiagram>
            <telerik:RadDiagramShape x:Name="ConditionShape"
                                     Height="30"
                                     Content="Router"
                                     FontWeight="Bold"
                                     Geometry="{telerik:FlowChartShape ShapeType=Database1Shape}"
                                     Position="80,80" />
            <telerik:RadDiagramShape x:Name="StatementShape1"
                                     Content="PC 1"
                                     FontWeight="Bold"
                                     Position="120,220" />
            <telerik:RadDiagramConnection VerticalContentAlignment="Top"
                                          Content="{Binding IpAddress}"
                                          FontWeight="Bold"
                                          Source="{Binding ElementName=ConditionShape}"
                                          Target="{Binding ElementName=StatementShape1}"
                                          TargetCapType="Arrow1Filled">
                <telerik:RadDiagramConnection.ContentTemplate>
                    <DataTemplate>
                        <StackPanel Margin="-60,5,0,0" Orientation="Horizontal">
                            <TextBlock Text="Interface: " />
                            <TextBlock Text="{Binding}" />
                        </StackPanel>
                    </DataTemplate>
                </telerik:RadDiagramConnection.ContentTemplate>
            </telerik:RadDiagramConnection>
        </telerik:RadDiagram>
    </Grid>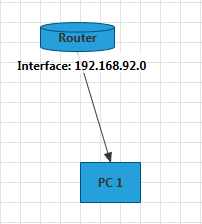
Customize the Connection Appearance
You can easily customize the visual appearance of the RadDiagramConnection by using the following properties:
Stroke: Gets or sets the brush that specifies how the RadDiagramConnection is painted.
StrokeDashArray: Gets or sets a collection of Double values that indicate the pattern of dashes and gaps that is used to outline the RadDiagramConnection.
StrokeThickness: Gets or sets the width of the RadDiagramConnection outline.
Background: Gets or sets the brush that specifies the SourceCap and TargetCap inner background.
You can use the RadDiagram.ConnectionStyle property to explicitely apply a style on all RadDiagramConnections in a RadDiagram instance. Read more.
Connection Edit Mode
You can set the RadDiagramConnection in edit mode using the IsInEditMode property. By default when an item enters edit mode, the RadDiagramConnection.Content is displayed inside a TextBox control so that you can change its value.
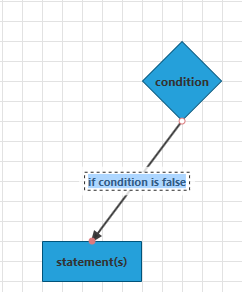
If the RadDiagramConnection.Content property is bound to a business item, you can set the connection EditTemplate to define how the business item will be edited. For example if we use the DataItem class, defined above, as a DataContext of the RadDiagram, we can set up the following connection:
Example 27: Set EditTemplate
<Grid>
    <telerik:RadDiagram>
        <telerik:RadDiagramShape x:Name="ConditionShape"
                                 Height="30"
                                 Content="Router"
                                 FontWeight="Bold"
                                 Geometry="{telerik:FlowChartShape ShapeType=Database1Shape}"
                                 Position="80,80" />
        <telerik:RadDiagramShape x:Name="StatementShape1"
                                 Width="100"
                                 Content="PC 1"
                                 FontWeight="Bold"
                                 Position="120,220" />
        <telerik:RadDiagramConnection VerticalContentAlignment="Top"
                                      Content="{Binding}"
                                      FontWeight="Bold"
                                      Source="{Binding ElementName=ConditionShape}"
                                      Target="{Binding ElementName=StatementShape1}"
                                      TargetCapType="Arrow1Filled">
            <telerik:RadDiagramConnection.ContentTemplate>
                <DataTemplate>
                    <TextBlock Text="{Binding IpAddress}" />
                </DataTemplate>
            </telerik:RadDiagramConnection.ContentTemplate>
            <telerik:RadDiagramConnection.EditTemplate>
                <DataTemplate>
                    <TextBox Text="{Binding IpAddress}" />
                </DataTemplate>
            </telerik:RadDiagramConnection.EditTemplate>
        </telerik:RadDiagramConnection>
    </telerik:RadDiagram>
</Grid>
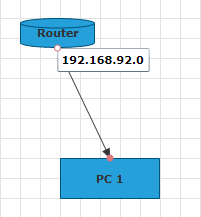
Apart from setting the IsInEditMode property to True, you can also enter edit mode by pressing F2 or double-clicking on the shape. For more information please refer to the Items Editing tutorial.
Connection Bridge
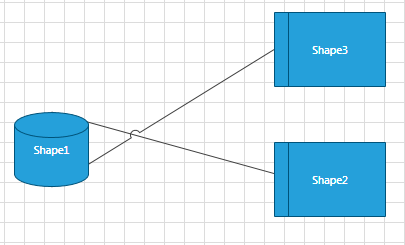
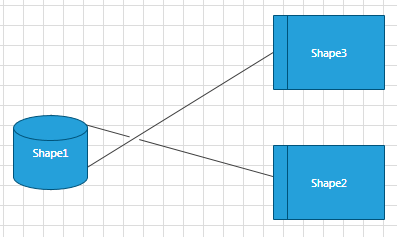
The Connection Bridge is essentially what you see when two connections collide. The RadDiagram allows you to define what kind of bridge to display through the ConnectionBridge property. It is an enumeration of type BridgeType that exposes the following members:
None: There is no bridge to visualize the intersection of the connections
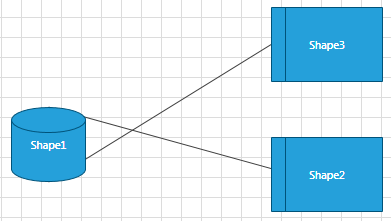
Bow: A half circle is displayed to indicate the intersection of the connections
Gap: A gap is displayed to indicate the intersection of the connections
Connection Selection State
The following properties allow you to track and control the selection state of a connection:
IsSelected: Gets or sets whether the connection is selected.
IsSelectedInGroup: Gets a value indicating whether this connection is selected in a group.
Connection ZIndex
You can get or set the z-order rendering behavior of the RadDiagramConnection through the ZIndex property.
Connection Bounds
You can get the bounds of a RadDiagramConnection through the Bounds property. It is of type Rect and it describes the width, height and location of the connection's bounds.
Use Free Connectors
With the R1 2019 version of our controls RadDiagramConnection now expose a UseFreeConnectors property. This Boolean property gets or sets whether the connection will choose free connectors when attaching to a shape. In the definition of free connectors means that no connections are outgoing or incoming for this connector of the shape.
The UseFreeConnectors property require the SourceConnectorPosition or TargetConnectorPosition to be set to Auto in order have effect.
Custom Connection
The RadDiagramConnection element exposes the CreateGeometry() method, which can be overridden to create a custom connection. In this section we will demonstrate how to use CreateGeometry() method to create our own connection.
Example 28: Create Custom Connection
public class CustomConnection : RadDiagramConnection
{
    protected override System.Windows.Media.Geometry CreateGeometry(Telerik.Windows.Diagrams.Core.BridgeType bridgeType, bool roundedCorners)
    {
        var newGeometry = new GeometryGroup();

        var startX = this.StartPoint.X;
        var startY = this.StartPoint.Y;

        var boundsLeft = Math.Min(this.StartPoint.X, this.EndPoint.X);
        var boundsTop = Math.Min(this.StartPoint.Y, this.EndPoint.Y);

        var offsetX = Math.Abs(this.EndPoint.X - this.StartPoint.X);
        var offsetY = Math.Abs(this.EndPoint.Y - this.StartPoint.Y);
        var segmentsCount = (int)Math.Max(3, Math.Max(offsetX / Math.Pow(offsetX, 0.5) / 3, offsetY / Math.Pow(offsetY, 0.5) / 3));

        var xStep = (this.EndPoint.X - this.StartPoint.X) / Math.Pow(segmentsCount, 2) / 2;
        var yStep = (this.EndPoint.Y - this.StartPoint.Y) / Math.Pow(segmentsCount, 2) / 2;

        for (int i = 1; i <= segmentsCount; i++)
        {

            var center = new Point(startX + xStep * (2 * i * i - i) - boundsLeft, startY + yStep * (2 * i * i - i) - boundsTop);
            newGeometry.Children.Add(new EllipseGeometry(center, Math.Max(2, Math.Abs(xStep) * i), Math.Max(2, Math.Abs(yStep) * i)));
        }
        return newGeometry;
    }
}
Example 29: Declare Custom Connection
<telerik:RadDiagram x:Name="diagram">
    <telerik:RadDiagramShape x:Name="shape1" Position="200 160" />
    <telerik:RadDiagramShape x:Name="shape2"
                                Geometry="{telerik:CommonShape ShapeType=OctagonShape}"
                                Position="540 150" />
    <local:CustomConnection Source="{Binding ElementName=shape1}" Target="{Binding ElementName=shape2}"
                            StrokeThickness="2"
                            Background="Blue"/>
</telerik:RadDiagram>