Chart Area
ChartArea is the place, where the chart graphic is drawn. The ChartArea represents a layout region of the RadChart control that holds certain chart series and axis data. Additionally, the ChartArea exposes events for customizing the tooltips and making the chart more interactive.
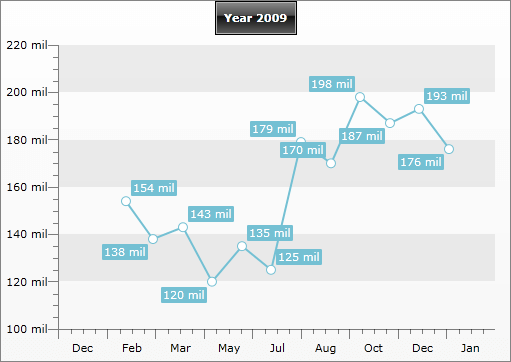
As you can see on the image above, the ChartArea has two axes - X and Y. By default X- and Y-axes are shown for all chart types except for those, which do not have axes at all - Pie and Doughnut charts.
Use ChartArea.AxisX and ChartArea.AxisY to access the specific properties of the axes. You can also apply your own styles using AxisXStyle and AxisYStyle. Take a look at the Styling the Axes topic for more.
Use the AdditionalYAxes property to add more than one Y-Axis to your chart. To learn more about it read the Multiple Y Axes topic.
Use the PlotAreaAxisXStyle and the PlotAreaAxisYStyle properties to set styles for the axes drawn inside the plot area. Example of such axes are the axes drawn in negative values scenarios.
RadChart also allows you to specify how to format the labels by specifying ChartArea.LabelFormatBehavior. The LabelFormatBehaviour enumeration has three values: HumanReadable(default), Scientific and None. The table below shows how the values will be formatted for the first two options. When None is used the values are converted using ToString() manner:
| Value | HumanReadable | Scientific |
|---|---|---|
| 100 | 100 | 1.00E+02 |
| 100,000 | 100 k | 1.00E+05 |
| 100,000,000 | 100 mil | 1.00E+08 |
| 100,000,000,000 | 100 bil | 1.00E+11 |
| 100,000,000,000,000 | 100 tri | 1.00E+14 |
| 1,000,000,000,000,000 | 1000 tri | 1.00E+15 |
When you set the label format behavior, all the labels (axes, series item labels, tooltips) will be formatted using the logic shown above. However, if you set Format Expressions to an element, then this expression will override the selected LabelFormatBehavior. For example, set the format behavior to Scientific, but for X-Axis set DefaultLabelFormat to "MMM":
<telerik:RadChart>
    <telerik:RadChart.DefaultView>
        <telerik:ChartDefaultView>
            <!--  ....  -->
            <telerik:ChartDefaultView.ChartArea>
                <telerik:ChartArea LabelFormatBehavior="HumanReadable">
                    <telerik:ChartArea.AxisX>
                        <telerik:AxisX DefaultLabelFormat="MMM"
                                       IsDateTime="True"
                                       LayoutMode="Between" />
                    </telerik:ChartArea.AxisX>
                    <telerik:ChartArea.DataSeries>
                    <!--  ....  -->
                    </telerik:ChartArea.DataSeries>
                </telerik:ChartArea>
            </telerik:ChartDefaultView.ChartArea>
        </telerik:ChartDefaultView>
    </telerik:RadChart.DefaultView>
</telerik:RadChart>
RadChart radChart = new RadChart();

radChart.DefaultView.ChartArea.LabelFormatBehavior = LabelFormatBehavior.HumanReadable;
radChart.DefaultView.ChartArea.AxisX.IsDateTime = true;
radChart.DefaultView.ChartArea.AxisX.DefaultLabelFormat = "MMM";
radChart.DefaultView.ChartArea.AxisX.LayoutMode = AxisLayoutMode.Between;
//...
Dim radChart As New Telerik.Windows.Controls.RadChart()
'....'
radChart.DefaultView.ChartArea.LabelFormatBehavior = LabelFormatBehavior.HumanReadable
radChart.DefaultView.ChartArea.AxisX.IsDateTime = True
radChart.DefaultView.ChartArea.AxisX.DefaultLabelFormat = "MMM"
radChart.DefaultView.ChartArea.AxisX.LayoutMode = AxisLayoutMode.Between
On the image below you can see how the Y-Axis and the series item labels are formatted when LayoutFormatBehavior is set to HumanReadable, while the X-Axis is formatted using custom Format Expressions: