Overview
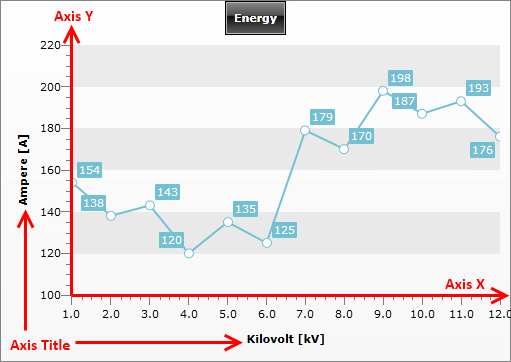
Axes in a chart are used to display the dimensions of the data. The X-axis and the Y-axis are contained in the ChartArea and can be customized in XAML or code-behind.

Both, AxisX and AxisY inherit Axis, thus sharing common properties, like:
MinValue and MaxValue - use to set the minimal and maximal value of the axis. (AutoRange must be set to false for the Step to be regarded)
Step - indicates the step used when placing ticks along the axis. (AutoRange must be set to false for the Step to be regarded)
AutoRange - when True the axis will calculate its MinValue, MaxValue and Step automatically. When False, you have to manually set the appropriate values for each of these properties.
DefaultLabelFormat - specifies the format used when labels are placed along the axis.
AxisLabelsVisibility - specifies whether the labels for the major ticks should be visible.
Title - gets or sets the title that is shown next to the axis.
However, there are some specific properties for each of the axes: check X-Axis and Y-Axis for more information.
The following example demonstrates how to use the common properties in XAML and code-behind:
<telerik:RadChart>
    <telerik:RadChart.DefaultView>
        <telerik:ChartDefaultView>
            <!--...-->
            <telerik:ChartDefaultView.ChartArea>
                <telerik:ChartArea>
                    <telerik:ChartArea.AxisX>
                        <telerik:AxisX AutoRange="True" DefaultLabelFormat="0.0" Title="Kilovolt [kV]" />
                    </telerik:ChartArea.AxisX>
                    <telerik:ChartArea.AxisY>
                        <telerik:AxisY AutoRange="False" MinValue="100" MaxValue="200" Step="5"
                                       DefaultLabelFormat="0" Title="Ampere [A]"/>
                    </telerik:ChartArea.AxisY>
                    <!--...-->
                </telerik:ChartArea>
            </telerik:ChartDefaultView.ChartArea>
        </telerik:ChartDefaultView>
    </telerik:RadChart.DefaultView>
</telerik:RadChart>
RadChart radChart = new RadChart();
radChart.DefaultView.ChartArea.AxisX.AutoRange = true;
radChart.DefaultView.ChartArea.AxisX.DefaultLabelFormat = "0.0";
radChart.DefaultView.ChartArea.AxisX.Title = "Kilovolt [kV]";
radChart.DefaultView.ChartArea.AxisY.AutoRange = false;
radChart.DefaultView.ChartArea.AxisY.MinValue = 100;
radChart.DefaultView.ChartArea.AxisY.MaxValue = 200;
radChart.DefaultView.ChartArea.AxisY.Step = 5;
radChart.DefaultView.ChartArea.AxisY.DefaultLabelFormat = "0";
radChart.DefaultView.ChartArea.AxisY.Title = "Ampere [A]";
Dim radChart As New Telerik.Windows.Controls.RadChart()
radChart.DefaultView.ChartArea.AxisX.AutoRange = True
radChart.DefaultView.ChartArea.AxisX.DefaultLabelFormat = "0.0"
radChart.DefaultView.ChartArea.AxisX.Title = "Kilovolt [kV]"
radChart.DefaultView.ChartArea.AxisY.AutoRange = False
radChart.DefaultView.ChartArea.AxisY.MinValue = 100
radChart.DefaultView.ChartArea.AxisY.MaxValue = 200
radChart.DefaultView.ChartArea.AxisY.[Step] = 5
radChart.DefaultView.ChartArea.AxisY.DefaultLabelFormat = "0"
radChart.DefaultView.ChartArea.AxisY.Title = "Ampere [A]"
Instead of setting the MaxValue, MinValue and Step properties you can call the AddRange() method. This is more performant, because setting each the properties will trigger recalculations of the axis' values.
radChart.DefaultView.ChartArea.AxisX.AddRange(100, 200, 5);
radChart.DefaultView.ChartArea.AxisX.AddRange(100, 200, 5)
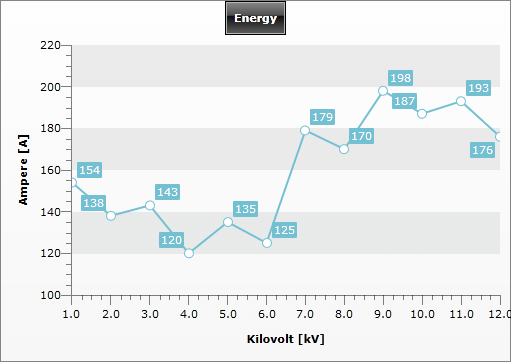
In the code snippet above, both the X and the Y axes are customized. The changes done for the Y-axis are several, but probably the most important of them is that the range auto generation (AutoRange = False) for that axis is stopped and this is done manually by defining values for MinValue, MaxValue and Step. The result is Y-axis with values starting from 100, ending at 200 with tick placed on each 5 units.
The manual range definition is very useful feature because it allows you to justify the visualization of your axes better.
