Interactivity
The main purpose of the charts is to display data in a graphical form. However, ChartArea control exposes numerous events, that allow you to make your charts more interactive.
The main ChartArea events that you can use to implement some kind of interactivity are:
ItemClick - occurs when the user clicks on a series item, for example a bar or a candle.
ItemToolTipClosing and ItemToolTipOpening - use to customize the ToolTip behavior. For more, see ToolTips.
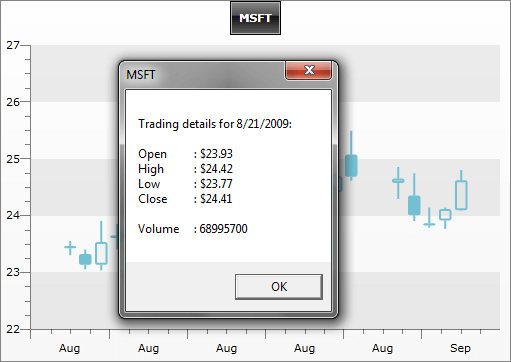
The example below shows a text box with some details when a candle is clicked. ItemClick event is also used to implement drill-down charts.
<telerik:ChartDefaultView.ChartArea>
    <telerik:ChartArea ItemClick="ChartArea_ItemClick" />
</telerik:ChartDefaultView.ChartArea>
public Sample()
{
    InitializeComponent();
    radChart.DefaultView.ChartArea.ItemClick += new EventHandler<ChartItemClickEventArgs>( ChartArea_ItemClick );
}

private void ChartArea_ItemClick( object sender, ChartItemClickEventArgs e )
{
    TradeData td = e.DataPoint.DataItem as TradeData;
    MessageBox.Show( string.Format(
        "Trading details for {0:d}:\n\nOpen\t: {1:c}\nHigh\t: {2:c}\nLow\t: {3:c}\nClose\t: {4:c}\n\nVolume\t: {5}",
        td.FromDate, td.Open, td.High, td.Low, td.Close, td.Volume ), td.Emission, MessageBoxButton.OK );
}
Private Sub ChartArea_ItemClick(ByVal sender As Object, ByVal e As ChartItemClickEventArgs)
    Dim td As TradeData = TryCast(e.DataPoint.DataItem, TradeData)
    MessageBox.Show(String.Format("Trading details for {0:d}:" & vbLf & vbLf & "Open" & vbTab & ": {1:c}" & vbLf & "High" & vbTab & ": {2:c}" & vbLf & "Low" & vbTab & ": {3:c}" & vbLf & "Close" & vbTab & ": {4:c}" & vbLf & vbLf & "Volume" & vbTab & ": {5}", td.FromDate, td.Open, td.High, td.Low, td.Close, _
     td.Volume), td.Emission, MessageBoxButton.OK)
End Sub
On the snapshot below you can see the MessageBox shown when the user has clicked on a candle. The formatted text message takes detailed information from the underlying business object, which is accessible through the ChartItemClickEventArgs.DataPoint.DataItem.
Programmatically select items in ChartArea
The latest version of the Chart control includes an enhancement of the Selection mechanism. It allows the developer to programmatically select items in the control. The following code snippet demonstrates one such scenario:
private void Button_Click(object sender, RoutedEventArgs e)
{
    foreach (DataPoint dataPoint1 in this.radChart.DefaultView.ChartArea.DataSeries[0])
    {
        if (dataPoint1.YValue == 154.0)
            this.radChart.DefaultView.ChartArea.SelectItem(dataPoint1);
    }
}
Private Sub Button_Click(sender As Object, e As RoutedEventArgs)
    For Each dataPoint1 As DataPoint In Chart1.DefaultView.ChartArea.DataSeries(0)
        If dataPoint1.YValue = 154.0 Then
            Chart1.DefaultView.ChartArea.SelectItem(dataPoint1)
        End If
    Next
End Sub
There are two main methods, which handle the selection. The first one is: Chart1.DefaultView.ChartArea.SelectItem - this method has a few overloads, but in general accepts a datapoint, or an index pointing to a specific datapoint in the chart series. The Chart1.DefaultView.ChartArea.SelectItems method allows the selection of multiple datapoints, which are specified through the parameters.