X-Axis
This topic covers only the properties that are specific to the X-axis. If you want to learn more about the properties that are common to both X and Y axes take a look at the Axes Overview topic.
Besides the common properties X-axis has some specific properties, explained in the list below:
IsDateTime - indicates where the values for the X-axis are considered as dates.
LayoutMode - specifies the LayoutMode applied on the horizontal axis.
LabelRotationAngle - specifies the value indicating the rotation angle for the X-axis labels. Use when label texts are long and are overlapping each-other.
LabelStep - specifies the value indicating that only one out of n-axis labels should be visible, where n is the value of the property.
TicksDistance - specifies a value indicating that every axis tick should be placed at least X pixels away from the next one, where X is the value of the property. Use when you have too much data to display on the X-axis to control the number of ticks shown.
StepLabelLevelCount - gets or sets the number of levels (steps) that will be used to distribute the axis item labels.
StepLabelLevelHeight - gets or sets the height of each step label level (row).
AxisX.Step and AxisX.LabelStep are related:
First,AxisX.Step is used to calculate which tick should be visible and which not.
Second, having the ticks,AxisX.LabelStep is used to calculate for which ticks the label should be visible and for which it souldn't. It means that the AxisX.LabelStep takes the ticks as a base.Here is
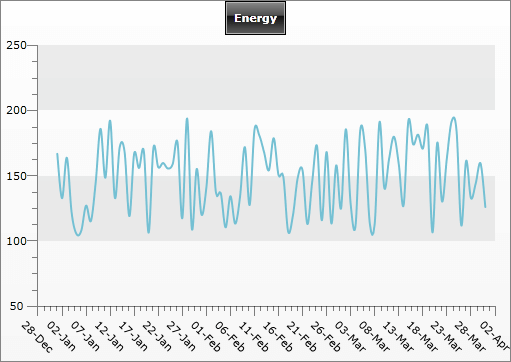
Here is an example for a RadChart that makes use of the Step, LabelStep, StepLableLevelCount, StepLabelLevelHeight:
<telerik:RadChart x:Name="radChart">
    <telerik:RadChart.SeriesMappings>
        <telerik:SeriesMapping>
            <telerik:SeriesMapping.SeriesDefinition>
                <telerik:SplineSeriesDefinition ShowItemLabels="False" ShowPointMarks="False" />
            </telerik:SeriesMapping.SeriesDefinition>
            <telerik:SeriesMapping.ItemMappings>
                <telerik:ItemMapping DataPointMember="XValue" FieldName="Date" />
                <telerik:ItemMapping DataPointMember="YValue" FieldName="Value" />
            </telerik:SeriesMapping.ItemMappings>
        </telerik:SeriesMapping>
    </telerik:RadChart.SeriesMappings>
    <telerik:RadChart.DefaultView>
        <telerik:ChartDefaultView>
            <!--  ...  -->
            <telerik:ChartDefaultView.ChartArea>
                <telerik:ChartArea>
                    <telerik:ChartArea.AxisX>
                        <telerik:AxisX DefaultLabelFormat="dd-MMM"
                                       IsDateTime="True"
                                       LabelStep="2"
                                       Step="5"
                                       StepLabelLevelCount="3"
                                       StepLabelLevelHeight="10" />
                    </telerik:ChartArea.AxisX>
                </telerik:ChartArea>
            </telerik:ChartDefaultView.ChartArea>
        </telerik:ChartDefaultView>
    </telerik:RadChart.DefaultView>
</telerik:RadChart>
//....
radChart.DefaultView.ChartArea.AxisX.AutoRange = false;
radChart.DefaultView.ChartArea.AxisX.MinValue = new DateTime( 2009, 1, 1 ).ToOADate();
radChart.DefaultView.ChartArea.AxisX.MaxValue = new DateTime( 2009, 3, 31 ).ToOADate();
radChart.DefaultView.ChartArea.AxisX.Step = 5;
radChart.DefaultView.ChartArea.AxisX.LabelStep = 2;
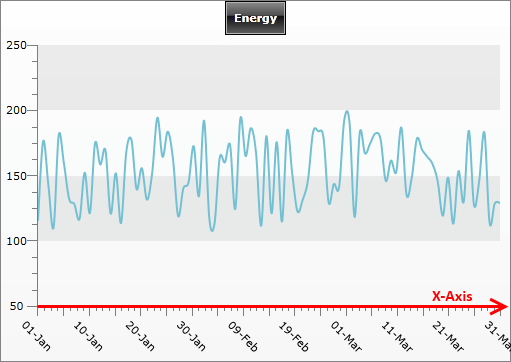
radChart.DefaultView.ChartArea.AxisX.LabelRotationAngle = 45;
radChart.DefaultView.ChartArea.AxisX.DefaultLabelFormat = "dd-MMM";
//....
Dim radChart As New Telerik.Windows.Controls.RadChart()
radChart.DefaultView.ChartArea.AxisX.IsDateTime = True
radChart.DefaultView.ChartArea.AxisX.Step = 5
radChart.DefaultView.ChartArea.AxisX.LabelStep = 2
radChart.DefaultView.ChartArea.AxisX.StepLabelLevelCount = 3
radChart.DefaultView.ChartArea.AxisX.StepLabelLevelHeight = 10
radChart.DefaultView.ChartArea.AxisX.DefaultLabelFormat = "dd-MMM"
'...'
Dim sm As New SeriesMapping()
sm.SeriesDefinition = New SplineSeriesDefinition()
sm.SeriesDefinition.ShowItemLabels = False
DirectCast(sm.SeriesDefinition, SplineSeriesDefinition).ShowPointMarks = False
sm.ItemMappings.Add(New ItemMapping("Date", DataPointMember.XValue))
sm.ItemMappings.Add(New ItemMapping("Value", DataPointMember.YValue))
radChart.SeriesMappings.Add(sm)
The TickDistance has to be used together with AutoRange. When AutoRange is set to True, the axis Step value is calculated depending on the data range, the available space and the TicksDistance value. Since TickDistance defines the minimal distance between two ticks, increasing its value will cause the Step value to be increased too.
When AutoRange is False, TickDistance is omitted, because in this case you have to manually provide values for MinValues, MaxValues and Step.
The following example demonstrates how to customize the X-Axis. The chart is bound (see Data Binding Support Overview or Data Binding with Manual Series Mapping for more about data binding) to a list of business objects with two properties: Date and Value - of type DateTime and decimal respectively. The list contains data for a three months period.
<telerik:RadChart>
    <telerik:RadChart.SeriesMappings>
        <telerik:SeriesMapping>
            <telerik:SeriesMapping.SeriesDefinition>
                <telerik:SplineSeriesDefinition ShowItemLabels="False" ShowPointMarks="False" />
            </telerik:SeriesMapping.SeriesDefinition>
            <telerik:SeriesMapping.ItemMappings>
                <telerik:ItemMapping DataPointMember="XValue" FieldName="Date" />
                <telerik:ItemMapping DataPointMember="YValue" FieldName="Value" />
            </telerik:SeriesMapping.ItemMappings>
        </telerik:SeriesMapping>
    </telerik:RadChart.SeriesMappings>
    <telerik:RadChart.DefaultView>
        <telerik:ChartDefaultView>
            <!--  ....  -->
            <telerik:ChartDefaultView.ChartArea>
                <telerik:ChartArea>
                    <telerik:ChartArea.AxisX>
                        <telerik:AxisX AutoRange="True"
                                       DefaultLabelFormat="dd-MMM"
                                       IsDateTime="True"
                                       LabelRotationAngle="45" />
                    </telerik:ChartArea.AxisX>
                </telerik:ChartArea>
            </telerik:ChartDefaultView.ChartArea>
        </telerik:ChartDefaultView>
    </telerik:RadChart.DefaultView>
</telerik:RadChart>
Telerik.Windows.Controls.RadChart radChart = new Telerik.Windows.Controls.RadChart();
radChart.DefaultView.ChartArea.AxisX.AutoRange = true;
radChart.DefaultView.ChartArea.AxisX.LabelRotationAngle = 45;
radChart.DefaultView.ChartArea.AxisX.DefaultLabelFormat = "dd-MMM";
//....
SeriesMapping sm = new SeriesMapping();
sm.SeriesDefinition = new SplineSeriesDefinition();
//....
sm.ItemMappings.Add( new ItemMapping( "Date", DataPointMember.XValue ) );
sm.ItemMappings.Add( new ItemMapping( "Value", DataPointMember.YValue ) );
radChart.SeriesMappings.Add( sm );
Dim radChart As New Telerik.Windows.Controls.RadChart()
radChart.DefaultView.ChartArea.AxisX.AutoRange = True
radChart.DefaultView.ChartArea.AxisX.LabelRotationAngle = 45
radChart.DefaultView.ChartArea.AxisX.DefaultLabelFormat = "dd-MMM"
'...'
Dim sm As New SeriesMapping()
sm.SeriesDefinition = New SplineSeriesDefinition()
sm.SeriesDefinition.ShowItemLabels = False
DirectCast(sm.SeriesDefinition, SplineSeriesDefinition).ShowPointMarks = False
sm.ItemMappings.Add(New ItemMapping("Date", DataPointMember.XValue))
sm.ItemMappings.Add(New ItemMapping("Value", DataPointMember.YValue))
radChart.SeriesMappings.Add(sm)
You can see the result on the snapshot below:
When AutoRange is True, RadChart calculates the MinValue, MaxValue and the Step and draws ticks accordingly. Also, the labels are rotated to 45 degree and formatted to show only the date and a three letter month abbreviation.
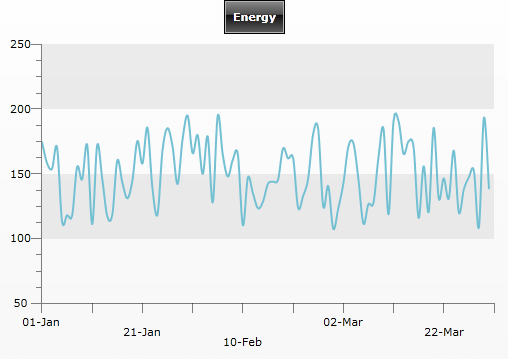
However, the chart above could be improved if a bit more ticks are shown. When AutoRange is True, then you can control the number of the ticks by playing with the TickDistance property. This property allows you to specify at least how many pixels you want to have between two ticks. Thus, decreasing the tick distance, more ticks could be placed on the axis. If the axis looks overcrowded, increase TickDistance value to reduce the number.
<!--  ....  -->
<telerik:ChartArea.AxisX>
    <telerik:AxisX AutoRange="True"
                   DefaultLabelFormat="dd-MMM"
                   IsDateTime="True"
                   LabelRotationAngle="45"
                   TicksDistance="15" />
</telerik:ChartArea.AxisX>
<!--  ....  -->
//....
radChart.DefaultView.ChartArea.AxisX.TicksDistance = 15;
//....
'....'
radChart.DefaultView.ChartArea.AxisX.TicksDistance = 15
'....'
As you can see, the number of the ticks is increased and the chart looks much better, because of the reduced step size. Notice the last date on the X-Axis - it is recalculated based on the new Step value and as a result, the chart is using the whole area - no offset on the right side.
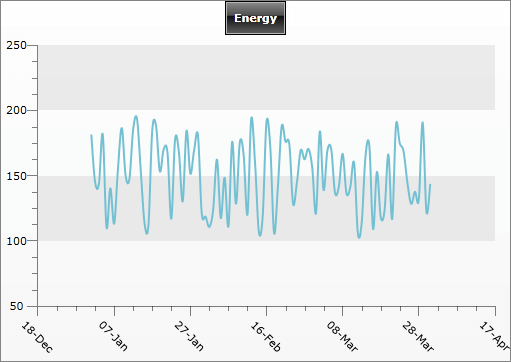
The same results you can achieve by setting the AutoRange to False and define MinValue, MaxValue and Step.
<!--  ...  -->
<telerik:ChartArea.AxisX>
    <telerik:AxisX AutoRange="False"
                   DefaultLabelFormat="dd-MMM"
                   IsDateTime="True"
                   LabelRotationAngle="45"
                   LabelStep="2"
                   MaxValue="39903.0"
                   MinValue="39814.0"
                   Step="5" />
</telerik:ChartArea.AxisX>
<!--  ...  -->
//....
radChart.DefaultView.ChartArea.AxisX.AutoRange = false;
radChart.DefaultView.ChartArea.AxisX.MinValue = new DateTime( 2009, 1, 1 ).ToOADate();
radChart.DefaultView.ChartArea.AxisX.MaxValue = new DateTime( 2009, 3, 31 ).ToOADate();
radChart.DefaultView.ChartArea.AxisX.Step = 5;
radChart.DefaultView.ChartArea.AxisX.LabelStep = 2;
radChart.DefaultView.ChartArea.AxisX.LabelRotationAngle = 45;
radChart.DefaultView.ChartArea.AxisX.DefaultLabelFormat = "dd-MMM";
//....
radChart.DefaultView.ChartArea.AxisX.AutoRange = False
radChart.DefaultView.ChartArea.AxisX.MinValue = New DateTime(2009, 1, 1).ToOADate()
radChart.DefaultView.ChartArea.AxisX.MaxValue = New DateTime(2009, 3, 31).ToOADate()
radChart.DefaultView.ChartArea.AxisX.Step = 5
radChart.DefaultView.ChartArea.AxisX.LabelStep = 2
radChart.DefaultView.ChartArea.AxisX.LabelRotationAngle = 45
radChart.DefaultView.ChartArea.AxisX.DefaultLabelFormat = "dd-MMM"
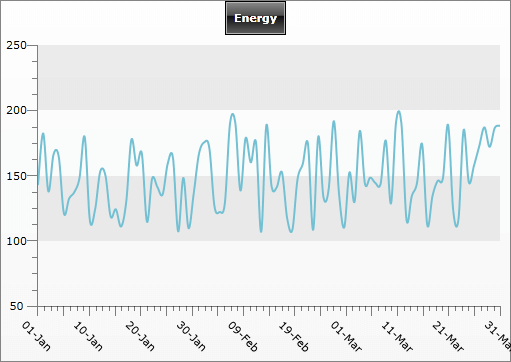
Notice how the MinValue and MaxValues are set - they are set to the OLE Automation equivalent of the DateTime value. In this example, 1 Jan 2009 and 31 Mar 2009. Additionally, the LabelStep is set to 2, which means that each second tick will have a label.