Multiple Y axes
RadChart supports multiple Y axes. It may be required when series of a different scale should be presented on the same graph. The only thing you have to do is to specify which axis to be used for each series definition.
To add more Y axes to a ChartArea, use ChartArea.AdditionalYAxes collection. Just create a new instance of AxisY, set a name using AxisY.AxisName property and add it to the collection. Add as many Y axes as you need. RadChart will arrange them one after the other. See Axes Overview and Y-Axis for more information.
Now, having the required number of additional Y-Axis, you have to link each data series to the appropriate Y-Axis. To do that, simply use the ISeriesDefinition.AxisName property and set the name of the Y-Axis. If you leave this property empty, RadChart will use the default Y-Axis.
The following example demonstrates how to add another Y-Axis and link it to a series definition. In this example, SeriesMapping/ItemMappingis is used to bind the data:
First, a new AxisY is added to ChartArea.AdditionalYAxes with AxisY.AxisName set to "AxisY_South".
Second, two series mappings are defined with CollectionIndex set to 0 and 1. See Data Binding to Many Chart Areas for more information.
Third, for the second series mapping, SeriesMapping.SeriesDefinition.AxisName is set to the name of the additionally added Y axis - "AxisY_South".
<telerik:RadChart x:Name="radChart">
    <telerik:RadChart.SeriesMappings>
        <telerik:SeriesMapping CollectionIndex="0" LegendLabel="North [MW]">
            <telerik:SeriesMapping.SeriesDefinition>
                <telerik:BarSeriesDefinition ShowItemLabels="False" />
            </telerik:SeriesMapping.SeriesDefinition>
            <telerik:SeriesMapping.ItemMappings>
                <telerik:ItemMapping FieldName="Value" DataPointMember="YValue"/>
            </telerik:SeriesMapping.ItemMappings>
        </telerik:SeriesMapping>
        <telerik:SeriesMapping CollectionIndex="1" LegendLabel="South [kW]">
            <telerik:SeriesMapping.SeriesDefinition>
                <telerik:BarSeriesDefinition ShowItemLabels="False" AxisName="AxisY_South" />
            </telerik:SeriesMapping.SeriesDefinition>
            <telerik:SeriesMapping.ItemMappings>
                <telerik:ItemMapping FieldName="Value" DataPointMember="YValue"/>
            </telerik:SeriesMapping.ItemMappings>
        </telerik:SeriesMapping>
    </telerik:RadChart.SeriesMappings>
    <telerik:RadChart.DefaultView>
        <telerik:ChartDefaultView>
        <!--....-->
            <telerik:ChartDefaultView.ChartArea>
                <telerik:ChartArea LegendName="chartLegend">
                    <telerik:ChartArea.AxisX>
                        <telerik:AxisX AutoRange="True" />
                    </telerik:ChartArea.AxisX>
                    <telerik:ChartArea.AxisY>
                        <telerik:AxisY Title="Megawatt [MW]" />
                    </telerik:ChartArea.AxisY>
                    <telerik:ChartArea.AdditionalYAxes>
                        <telerik:AxisY Title="Kilowatt [kW]" AxisName="AxisY_South" />
                    </telerik:ChartArea.AdditionalYAxes>
                </telerik:ChartArea>
            </telerik:ChartDefaultView.ChartArea>
        </telerik:ChartDefaultView>
    </telerik:RadChart.DefaultView>
</telerik:RadChart>
Telerik.Windows.Controls.RadChart radChart = new Telerik.Windows.Controls.RadChart();
//....
radChart.DefaultView.ChartArea.AxisY.Title = "Megawatt [MW]";
AxisY axisY = new AxisY();
axisY.AxisName = "AxisY_South";
axisY.Title = "Kilowatt [kW]";
radChart.DefaultView.ChartArea.AdditionalYAxes.Add( axisY );
//....
//Series mapping for the collection with index 0
SeriesMapping seriesMapping = new SeriesMapping();
seriesMapping.CollectionIndex = 0;
seriesMapping.LegendLabel = "North [MW]";
seriesMapping.SeriesDefinition = new BarSeriesDefinition();
seriesMapping.SeriesDefinition.ShowItemLabels = false;
seriesMapping.ItemMappings.Add( new ItemMapping( "Value", DataPointMember.YValue ) );
radChart.SeriesMappings.Add( seriesMapping );
//Series mapping for the collection with index 1
seriesMapping = new SeriesMapping();
seriesMapping.CollectionIndex = 1;
seriesMapping.LegendLabel = "South [kW]";
seriesMapping.SeriesDefinition = new BarSeriesDefinition();
seriesMapping.SeriesDefinition.AxisName = "AxisY_South";
seriesMapping.SeriesDefinition.ShowItemLabels = false;
seriesMapping.ItemMappings.Add( new ItemMapping( "Value", DataPointMember.YValue ) );
radChart.SeriesMappings.Add( seriesMapping );
radChart.ItemsSource = this.DataContext;
Dim radChart As New Telerik.Windows.Controls.RadChart()
'....'
radChart.DefaultView.ChartArea.AxisY.Title = "Megawatt [MW]"
Dim axisY As New AxisY()
axisY.AxisName = "AxisY_South"
axisY.Title = "Kilowatt [kW]"
radChart.DefaultView.ChartArea.AdditionalYAxes.Add(axisY)
'....'
'Series mapping for the collection with index 0 '
Dim seriesMapping As New SeriesMapping()
seriesMapping.CollectionIndex = 0
seriesMapping.LegendLabel = "North [MW]"
seriesMapping.SeriesDefinition = New BarSeriesDefinition()
seriesMapping.SeriesDefinition.ShowItemLabels = False
seriesMapping.ItemMappings.Add(New ItemMapping("Value", DataPointMember.YValue))
radChart.SeriesMappings.Add(seriesMapping)
'Series mapping for the collection with index 1 '
seriesMapping = New SeriesMapping()
seriesMapping.CollectionIndex = 1
seriesMapping.LegendLabel = "South [kW]"
seriesMapping.SeriesDefinition = New BarSeriesDefinition()
seriesMapping.SeriesDefinition.AxisName = "AxisY_South"
seriesMapping.SeriesDefinition.ShowItemLabels = False
seriesMapping.ItemMappings.Add(New ItemMapping("Value", DataPointMember.YValue))
radChart.SeriesMappings.Add(seriesMapping)
radChart.ItemsSource = Me.DataContext
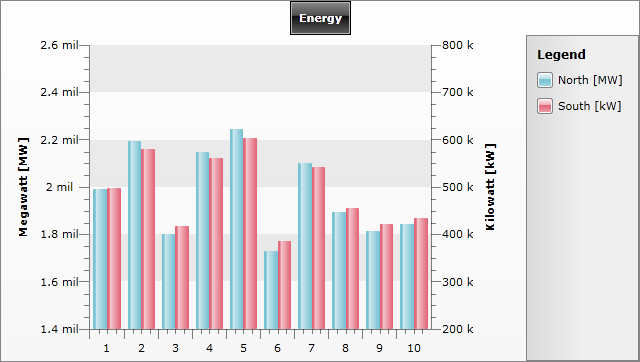
As you can see on the snapshot below, the chart contains two series - one for the energy consumption for the northern part of a country and another one for the southern part. The first one is bound to the default Y-Axis and its scale is in Megawatt. The second one is linked to the additionally added Y-axis and the data is in Kilowatts: