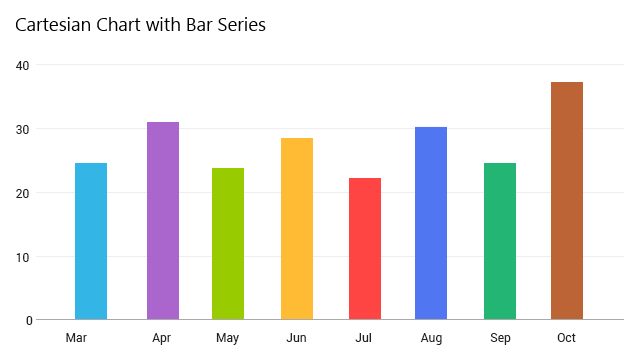
RadCartesianChartView is one of the RadChartView types. This chart visualizes its data points using the Cartesian coordinate system. The X and Y axes define how the coordinates of each point in the plot area are calculated and the series type define the way these data points will be visualized.

RadCartesianChartView can visualize the following types of series:
-
LineSeries: Visualizes a collection of data points using a Line.
-
SplineSeries: Visualizes a collection of data points using a Curve.
-
AreaSeries: Represents a chart series that are visualized like an area figure in the Cartesian space.
-
SplineAreaSeries: Represents series which define an area with smooth curves among points.
-
BarSeries: Represents a chart series that plot their points using rectangular shapes, named "Bars". RadCartesianChartView can display BarSeries both horizontally and vertically. If the series are more than one, they can be stacked.
-
RangeBarSeries: Represents a chart range bar series. Both BarSeries and RangeBarSeries display its data points as bars. However the bars in BarSeries represent just a single value and the bars in RangeBarSeries represent low value and high value.
RadCartesianChartView needs to have two axes which will be used to calculate correctly the position of each data point. Usually one of the axes will be used to display the category of each data point and the other will represent its value. Here are the supported axes:
-
Category Axes
-
CategoricalAxis: Arranges the plotted data points in categories where the key of each category is the point's value (if available) for that axis or its index within the points collection. The point's coordinate, specified by this axis is discrete and is calculated depending on the size of the category slot where the point resides.
-
DateTimeCategoricalAxis: This is a special categorical axis that expects each data point to provide a
java.util.Calendar structure as its value for this axis. The points are grouped by a user-defined date-time component (Year, Month, Day, etc.) and then the groups are sorted chronologically.
-
DateTimeContinuousAxis: This is a special axis that expects each data point to provide a
java.util.Calendar structure as its value for this axis. You can think of DateTimeContinuousAxis as a timeline where the coordinate of each data point is calculated depending on the position of its associated DateTime on the timeline. The base unit (or the timeline step) of the axis is calculated depending on the smallest difference between any two dates.
-
Value Axes
-
LinearAxis: Calculates the coordinate of each data point, depending on the actual numerical value this point provides for the axis. A LinearAxis exposes Minimum and Maximum properties to allow for explicit definition of the range of values visible on this axis. If these properties are not specified, the axis will automatically calculate the range, depending on the minimum and maximum data point values.
-
LogarithmicAxis: Special linear axis that will transform each data point value using the logarithm function. Using LogarithmicAxis allows your app to show numerical data with huge delta between the minimum and the maximum to be visualized in a readable way.
In order to create a new instance of RadCartesianChartView you can follow the instructions from the Getting Started page of RadChartView.
