RadCartesianChartView need an axis that can represent the values of the data points. The base class for the axes that can represent value is NumericalAxis. It is an abstract class which extends the base CartesianAxis class and is used to represent the value of a data point.
The LinearAxis extends the base CartesianAxis class and plots the associated data points using each point's actual value, provided for the axis. The axis works with categorical data and uses the Value property of each CategoricalDataPoint that needs to be plotted. It will build a numerical range (user-defined or automatically calculated) and will determine each data point X or Y coordinate (depending on whether the axis is specified as Horizontal or as Vertical).
You can read from the Getting Started page how to define the MonthResult type and declare the initData() method.
After you create the method for initialization of sample data, you can create a RadCartesianChartView with LinearAxis by adding the following code to the onCreate() method of your Activity.
    initData();

    RadCartesianChartView chartView = new RadCartesianChartView(this);

    LineSeries lineSeries = new LineSeries();
    lineSeries.setCategoryBinding(new PropertyNameDataPointBinding("Month"));
    lineSeries.setValueBinding(new PropertyNameDataPointBinding("Result"));
    lineSeries.setData(this.monthResults);
    chartView.getSeries().add(lineSeries);

    CategoricalAxis horizontalAxis = new CategoricalAxis();
    chartView.setHorizontalAxis(horizontalAxis);

    LinearAxis verticalAxis = new LinearAxis();
    chartView.setVerticalAxis(verticalAxis);

    ViewGroup rootView = (ViewGroup)findViewById(R.id.container);
    rootView.addView(chartView);
    InitData();

    RadCartesianChartView chartView = new RadCartesianChartView(this);

    LineSeries lineSeries = new LineSeries();
    lineSeries.CategoryBinding = new MonthResultDataBinding ("Month");
    lineSeries.ValueBinding = new MonthResultDataBinding ("Result");
    lineSeries.Data = (Java.Lang.IIterable)this.monthResults;
    chartView.Series.Add(lineSeries);

    CategoricalAxis horizontalAxis = new CategoricalAxis();
    chartView.HorizontalAxis = horizontalAxis;

    LinearAxis verticalAxis = new LinearAxis();
    chartView.VerticalAxis = verticalAxis;

    ViewGroup rootView = (ViewGroup)FindViewById(Resource.Id.container);
    rootView.AddView(chartView);
This example assumes that you root container has id
container
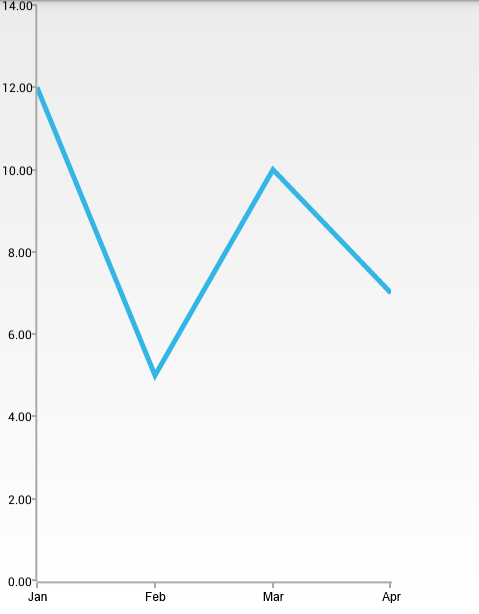
Here's the result:

The Major Step specifies the step at which the major ticks are positioned on the axis. If this property is set to 0 (by default), the axis automatically calculates the step so that the data will be visualized in the best possible way. For example, if you want to set the distance between the ticks to a fixed value like 10, you can use the method setMajorStep(double):
verticalAxis.setMajorStep(10);
verticalAxis.MajorStep = 10;
In order to retrieve the current value you can use getMajorStep().