Shared Tooltip for Telerik Blazor Stock Chart
The Telerik Stock Chart allows you to show a unified tooltip for all categories in the Chart.
In this article:
Basics
The shared tooltip provides summarized information of all data points from the hovered category. This tooltip will take precedence over tooltip settings defined for a specific series.
To enable the shared tooltip:
- Inside the
<TelerikStockChart>tag, add the<StockChartTooltip>tag. - Set its
Visibleparameter totrue. - Set its
Sharedparameter totrue.
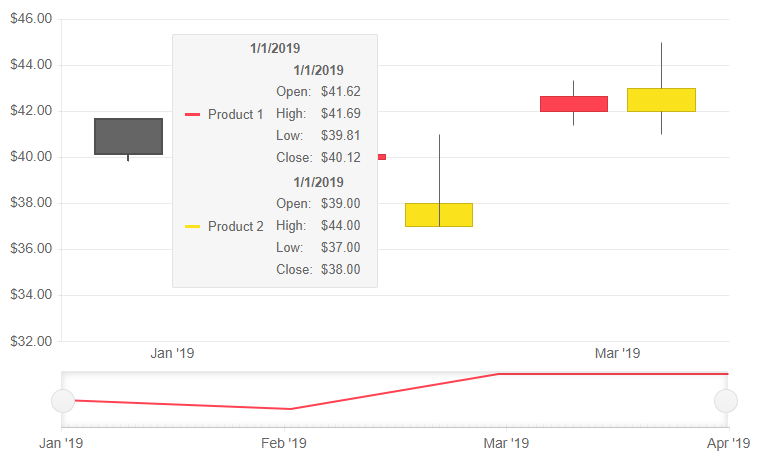
Basic configuration of a Stock Chart with Shared Tooltip
@* This example shows how to enable a Shared Tooltip *@

<TelerikStockChart Width="750px"
                   Height="450px"
                   DateField="@nameof(StockDataPoint.Date)">

    <StockChartTooltip Visible="true" Shared="true"></StockChartTooltip>

    <StockChartCategoryAxes>
        <StockChartCategoryAxis BaseUnit="@ChartCategoryAxisBaseUnit.Months"></StockChartCategoryAxis>
    </StockChartCategoryAxes>

    <StockChartSeriesItems>
        <StockChartSeries Type="StockChartSeriesType.Candlestick"
                          Name="Product 1"
                          Data="@StockChartProduct1Data"
                          OpenField="@nameof(StockDataPoint.Open)"
                          CloseField="@nameof(StockDataPoint.Close)"
                          HighField="@nameof(StockDataPoint.High)"
                          LowField="@nameof(StockDataPoint.Low)">
        </StockChartSeries>

        <StockChartSeries Type="StockChartSeriesType.Candlestick"
                          Name="Product 2"
                          Data="@StockChartProduct2Data"
                          OpenField="@nameof(StockDataPoint.Open)"
                          CloseField="@nameof(StockDataPoint.Close)"
                          HighField="@nameof(StockDataPoint.High)"
                          LowField="@nameof(StockDataPoint.Low)">
        </StockChartSeries>
    </StockChartSeriesItems>

    <StockChartNavigator>
        <StockChartNavigatorSeriesItems>
            <StockChartNavigatorSeries Type="StockChartSeriesType.Line"
                                       Name="Product 1"
                                       Data="@StockChartProduct1Data"
                                       Field="@(nameof(StockDataPoint.High))"
                                       CategoryField="@(nameof(StockDataPoint.Date))">
            </StockChartNavigatorSeries>
        </StockChartNavigatorSeriesItems>
    </StockChartNavigator>

</TelerikStockChart>


@code {
    public List<StockDataPoint> StockChartProduct1Data { get; set; }
    public List<StockDataPoint> StockChartProduct2Data { get; set; }

    protected override async Task OnInitializedAsync()
    {
        await GenerateChartData();
    }

    public async Task GenerateChartData()
    {
        StockChartProduct1Data = new List<StockDataPoint>()
        {
            new StockDataPoint(new DateTime(2019, 1, 1), 41.62m, 40.12m, 41.69m, 39.81m, 2632000),
            new StockDataPoint(new DateTime(2019, 2, 1), 39.88m, 40.12m, 41.12m, 39.75m, 3584700),
            new StockDataPoint(new DateTime(2019, 3, 1), 42m, 42.62m, 43.31m, 41.38m, 7631700),
            new StockDataPoint(new DateTime(2019, 4, 1), 42.25m, 43.06m, 43.31m, 41.12m, 4922200)
        };

        StockChartProduct2Data = new List<StockDataPoint>()
        {
            new StockDataPoint(new DateTime(2019, 1, 1), 39m, 38m, 44m, 37m, 26320),
            new StockDataPoint(new DateTime(2019, 2, 1), 37m, 38m, 41m, 40m, 35847),
            new StockDataPoint(new DateTime(2019, 3, 1), 42m, 43m, 45m, 41m, 76317),
            new StockDataPoint(new DateTime(2019, 4, 1), 40m, 42m, 43m, 42m, 49222)
        };

        await Task.FromResult(StockChartProduct1Data);
        await Task.FromResult(StockChartProduct2Data);
    }

    public class StockDataPoint
    {
        public StockDataPoint() { }

        public StockDataPoint(DateTime date, decimal open, decimal close, decimal high, decimal low, int volume)
        {
            Date = date;
            Open = open;
            Close = close;
            High = high;
            Low = low;
            Volume = volume;
        }
        public DateTime Date { get; set; }

        public decimal Open { get; set; }

        public decimal Close { get; set; }

        public decimal High { get; set; }

        public decimal Low { get; set; }

        public int Volume { get; set; }
    }
}
The result from the code snippet above
Customization
There are two types of customizations you can do for the tooltips:
- Parameter Settings - lets you alter cosmetic settings such as borders, colors and padding through simple parameters
- Shared Template - lets you control the entire content
Parameter Settings
You can customize the rendering of the Shared tooltip by using:
Background- control the background color by applying a CSS color string, including HEX and RGB. By default the it will match the color for the category.Color- control the text color by applying a CSS color string, including HEX and RGB.
Shared Template
The SharedTemplate allows you to control the rendering of the shared tooltip.
In the template you can:
Use business logic and render HTML
Use the
contextparameter that provides information about the current category and all data points in it.
The context contains the following information:
Category- renders the name of the Category.Points- a collection of data for each series data point in this category.
Each Point contains the following data:
-
DataItem- provides the data model of the current series item. You need to cast it to the type from your data source, which needs to be serializable.- For
OHLCandCandlestickchart types theDataItemwill contain the information mapped to theOpenField,CloseField,HighFieldandLowFieldproperties. - For
Line,AreaandColumntheDataItemwill contain the information mapped to theFieldproperties. - The
DataItemwill contain an aggregated value for the date, so in order to get it you can use theCategoryand parse it toDateTime.
- For
Category- provides information on the category the data point is located in. Since the Stock Chart has a date X axis theCategoryshould be cast toDateTime.SeriesIndex- provides the index of the<StockChartSeries>the data point belongs to.Percentage- for the Stock Chart the value will always be0.SeriesName- bound to the Name parameter of the<StockChartSeries>the data point belongs to.SeriesColor- shows the RGB color of the Series the data point belongs to.CategoryIndex- shows the index of the data point's x-axis category.
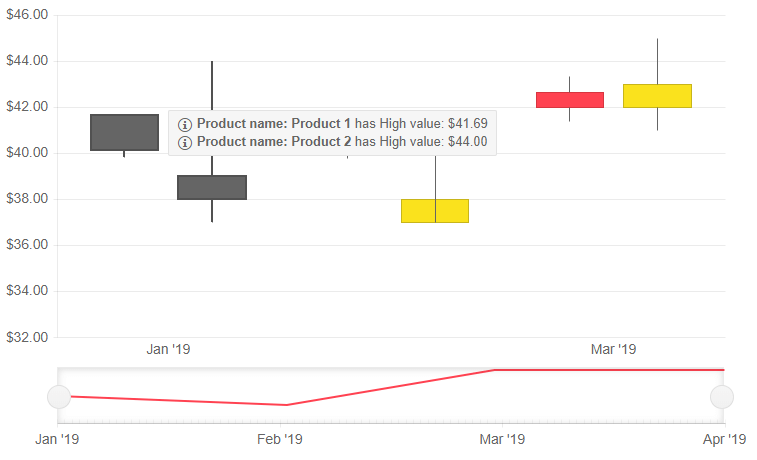
Usage of the SharedTemplate
@* This example shows how to use the SharedTemplate and extract information on the data points value and get the series name from the context *@

<TelerikStockChart Width="750px"
                   Height="450px"
                   DateField="@nameof(StockDataPoint.Date)">

    <StockChartTooltip Visible="true" Shared="true">
        <SharedTemplate>
            @{
                var points = context.Points;

                foreach (var point in points)
                {
                    <div>
                        <TelerikSvgIcon Icon="@SvgIcon.InfoCircle" />
                        <strong>Product name: @point.SeriesName</strong> has
                        High value: @(((point.DataItem as StockDataPoint).High).ToString("C2"))
                    </div>
                }
            }
        </SharedTemplate>
    </StockChartTooltip>

    <StockChartCategoryAxes>
        <StockChartCategoryAxis BaseUnit="@ChartCategoryAxisBaseUnit.Months"></StockChartCategoryAxis>
    </StockChartCategoryAxes>

    <StockChartSeriesItems>
        <StockChartSeries Type="StockChartSeriesType.Candlestick"
                          Name="Product 1"
                          Data="@StockChartProduct1Data"
                          OpenField="@nameof(StockDataPoint.Open)"
                          CloseField="@nameof(StockDataPoint.Close)"
                          HighField="@nameof(StockDataPoint.High)"
                          LowField="@nameof(StockDataPoint.Low)">
        </StockChartSeries>

        <StockChartSeries Type="StockChartSeriesType.Candlestick"
                          Name="Product 2"
                          Data="@StockChartProduct2Data"
                          OpenField="@nameof(StockDataPoint.Open)"
                          CloseField="@nameof(StockDataPoint.Close)"
                          HighField="@nameof(StockDataPoint.High)"
                          LowField="@nameof(StockDataPoint.Low)">
        </StockChartSeries>
    </StockChartSeriesItems>

    <StockChartNavigator>
        <StockChartNavigatorSeriesItems>
            <StockChartNavigatorSeries Type="StockChartSeriesType.Line"
                                       Name="Product 1"
                                       Data="@StockChartProduct1Data"
                                       Field="@(nameof(StockDataPoint.High))"
                                       CategoryField="@(nameof(StockDataPoint.Date))">
            </StockChartNavigatorSeries>
        </StockChartNavigatorSeriesItems>
    </StockChartNavigator>

</TelerikStockChart>

@code {
    public List<StockDataPoint> StockChartProduct1Data { get; set; }
    public List<StockDataPoint> StockChartProduct2Data { get; set; }

    protected override async Task OnInitializedAsync()
    {
        await GenerateChartData();
    }

    public async Task GenerateChartData()
    {
        StockChartProduct1Data = new List<StockDataPoint>()
        {
            new StockDataPoint(new DateTime(2019, 1, 1), 41.62m, 40.12m, 41.69m, 39.81m, 2632000),
            new StockDataPoint(new DateTime(2019, 2, 1), 39.88m, 40.12m, 41.12m, 39.75m, 3584700),
            new StockDataPoint(new DateTime(2019, 3, 1), 42m, 42.62m, 43.31m, 41.38m, 7631700),
            new StockDataPoint(new DateTime(2019, 4, 1), 42.25m, 43.06m, 43.31m, 41.12m, 4922200)
        };

        StockChartProduct2Data = new List<StockDataPoint>()
        {
            new StockDataPoint(new DateTime(2019, 1, 1), 39m, 38m, 44m, 37m, 26320),
            new StockDataPoint(new DateTime(2019, 2, 1), 37m, 38m, 41m, 40m, 35847),
            new StockDataPoint(new DateTime(2019, 3, 1), 42m, 43m, 45m, 41m, 76317),
            new StockDataPoint(new DateTime(2019, 4, 1), 40m, 42m, 43m, 42m, 49222)
        };

        await Task.FromResult(StockChartProduct1Data);
        await Task.FromResult(StockChartProduct2Data);
    }

    public class StockDataPoint
    {
        public StockDataPoint() { }

        public StockDataPoint(DateTime date, decimal open, decimal close, decimal high, decimal low, int volume)
        {
            Date = date;
            Open = open;
            Close = close;
            High = high;
            Low = low;
            Volume = volume;
        }
        public DateTime Date { get; set; }

        public decimal Open { get; set; }

        public decimal Close { get; set; }

        public decimal High { get; set; }

        public decimal Low { get; set; }

        public int Volume { get; set; }
    }
}
The result from the code snippet above