Line Chart
A Line chart displays data as continuous lines that pass through points defined by the values of their items. It is useful for rendering a trend over time and comparing several sets of similar data.
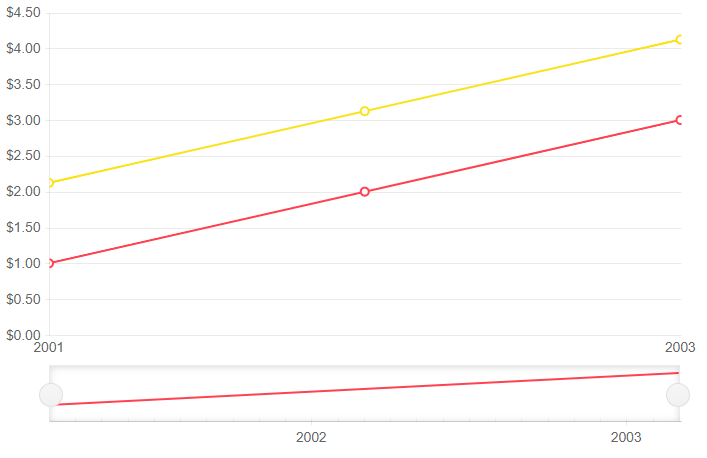
Line series in a stock chart. Results from the first code snippet below.
This article assumes you are familiar with the stock chart basics and data binding.
To add a Line chart to a stock chart component:
- add a
StockChartSeriesto theStockChartSeriesItemscollection - set its
Typeproperty toChartSeriesType.Line - provide a data collection to its
Dataproperty - set the
FieldandCategoryFieldproperties to the corresponding fields in the model that carry the values.
A line chart that shows product revenues
Line series

<TelerikStockChart Height="450px"
                   Width="700px">

    <StockChartCategoryAxes>
        <StockChartCategoryAxis BaseUnit="@ChartCategoryAxisBaseUnit.Years"></StockChartCategoryAxis>
    </StockChartCategoryAxes>

    <StockChartSeriesItems>
        <StockChartSeries Type="StockChartSeriesType.Line"
                          Name="Product 1"
                          Data="@Data"
                          Field="@nameof(ChartSeriesData.Product1Sales)"
                          CategoryField="@nameof(ChartSeriesData.Year)">
        </StockChartSeries>

        <StockChartSeries Type="StockChartSeriesType.Line"
                          Name="Product 1"
                          Data="@Data"
                          Field="@nameof(ChartSeriesData.Product2Sales)"
                          CategoryField="@nameof(ChartSeriesData.Year)">
        </StockChartSeries>
    </StockChartSeriesItems>

    <StockChartNavigator>
        <StockChartNavigatorSeriesItems>
            <StockChartNavigatorSeries Type="StockChartSeriesType.Line"
                                       Name="Product 1"
                                       Data="@Data"
                                       Field="@(nameof(ChartSeriesData.Product1Sales))"
                                       CategoryField="@(nameof(ChartSeriesData.Year))">
            </StockChartNavigatorSeries>
        </StockChartNavigatorSeriesItems>
    </StockChartNavigator>

</TelerikStockChart>

@code {
    public List<ChartSeriesData> Data { get; set; }

    protected override void OnInitialized()
    {
        Data = ChartSeriesData.GenerateData();
    }

    public class ChartSeriesData
    {
        public int Product1Sales { get; set; }
        public double Product2Sales { get; set; }
        public DateTime Year { get; set; }
        public string SegmentName { get; set; }

        public static List<ChartSeriesData> GenerateData()
        {
            List<ChartSeriesData> data = new List<ChartSeriesData>();

            for (int i = 1; i <= 3; i++)
            {
                var dataItem = new ChartSeriesData
                {
                    Product1Sales = i,
                    Product2Sales = i + 1.123,
                    Year = new DateTime(2000 + i, 3, i),
                    SegmentName = $"{i * 100}"
                };

                data.Add(dataItem);
            }

            return data;
        }
    }
}
Line Chart Specific Appearance Settings
Customize Chart Elements - Nested Tags Settings
When configuring nested properties and child elements in your chart, the inner tags will contain their parent tag name and add specifics to its end. In general the structure of such nested tags will be <StockChart*Category**Specifics*> where the Category can be one of the following:
- CategoryAxis
- ChartArea
- Legend
- Navigator
- PlotArea
- SeriesItems
- Title
- Tooltip
- ValueAxis
- and others
To customize the chart, look for nested tags and their properties - the inner tags will contain their parent tag name and add specifics to its end. For example, the
StockChartSeriestag has aStockChartSeriesTooltiptag that exposes configuration options and more child tags.
You can customize all aspects of the stock chart by using the settings provided by the nested tags.
For example:
StockChartCategoryAxes > StockChartCategoryAxis > StockChartCategoryAxisLabels tags
This approach can be used with all tags that are applicable for the Chart type.