Area Chart
An Area chart shows the data as continuous lines that pass through points defined by their items' values. The portion of the graph beneath the lines is filled with a particular color for every series. Colors in an Area chart can be useful for emphasizing changes in values from several sets of similar data. A colored background will clearly visualize the differences.
An Area chart emphasizes the volume of money, data or any other unit that the given series has encompassed. When backgrounds are semi-transparent, it lets the user clearly see where different sets of data overlap.
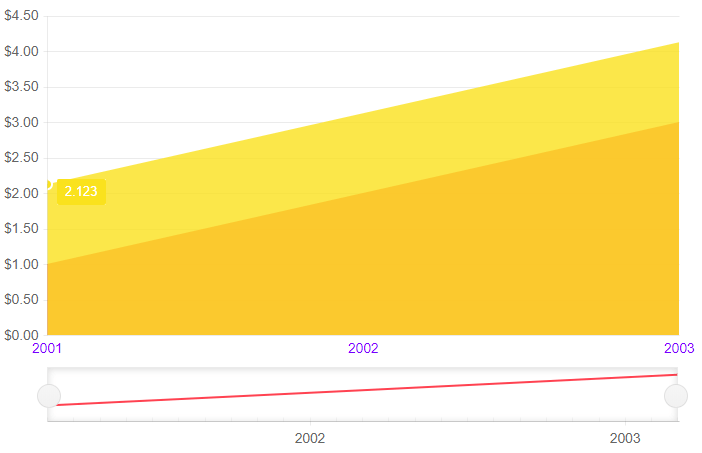
Area series in a stock chart. Results from the first code snippet below.
This article assumes you are familiar with the stock chart basics and data binding.
To add a Area chart to a stock chart component:
- add a
StockChartSeriesto theStockChartSeriesItemscollection - set its
Typeproperty toChartSeriesType.Area - provide a data collection to its
Dataproperty - set the
FieldandCategoryFieldproperties to the corresponding fields in the model that carry the values.
An area chart that shows product revenues
@*Area series*@

<TelerikStockChart Height="450px"
                   Width="700px">

    <StockChartCategoryAxes>
        <StockChartCategoryAxis BaseUnit="@ChartCategoryAxisBaseUnit.Years"></StockChartCategoryAxis>
    </StockChartCategoryAxes>

    <StockChartSeriesItems>
        <StockChartSeries Type="StockChartSeriesType.Area"
                          Name="Product 1"
                          Data="@Data"
                          Field="@nameof(ChartSeriesData.Product1Sales)"
                          CategoryField="@nameof(ChartSeriesData.Year)">
        </StockChartSeries>

        <StockChartSeries Type="StockChartSeriesType.Area"
                          Name="Product 1"
                          Data="@Data"
                          Field="@nameof(ChartSeriesData.Product2Sales)"
                          CategoryField="@nameof(ChartSeriesData.Year)">
        </StockChartSeries>

        <StockChartNavigator>
            <StockChartNavigatorSeriesItems>
                <StockChartNavigatorSeries Type="StockChartSeriesType.Line"
                                           Name="Product 1"
                                           Data="@Data"
                                           Field="@(nameof(ChartSeriesData.Product1Sales))"
                                           CategoryField="@(nameof(ChartSeriesData.Year))">
                </StockChartNavigatorSeries>
            </StockChartNavigatorSeriesItems>
        </StockChartNavigator>

    </StockChartSeriesItems>

</TelerikStockChart>

@code {
    public List<ChartSeriesData> Data { get; set; }

    protected override void OnInitialized()
    {
        Data = ChartSeriesData.GenerateData();
    }

    public class ChartSeriesData
    {
        public int Product1Sales { get; set; }
        public double Product2Sales { get; set; }
        public DateTime Year { get; set; }
        public string SegmentName { get; set; }

        public static List<ChartSeriesData> GenerateData()
        {
            List<ChartSeriesData> data = new List<ChartSeriesData>();

            for (int i = 1; i <= 3; i++)
            {
                var dataItem = new ChartSeriesData
                {
                    Product1Sales = i,
                    Product2Sales = i + 1.123,
                    Year = new DateTime(2000 + i, 3, i),
                    SegmentName = $"{i * 100}"
                };

                data.Add(dataItem);
            }

            return data;
        }
    }
}
Area Chart Specific Appearance Settings
Color
The color of a series is controlled through the Color property that can take any valid CSS color (for example, #abcdef, #f00, or blue). The Color controls the fill color of the area.
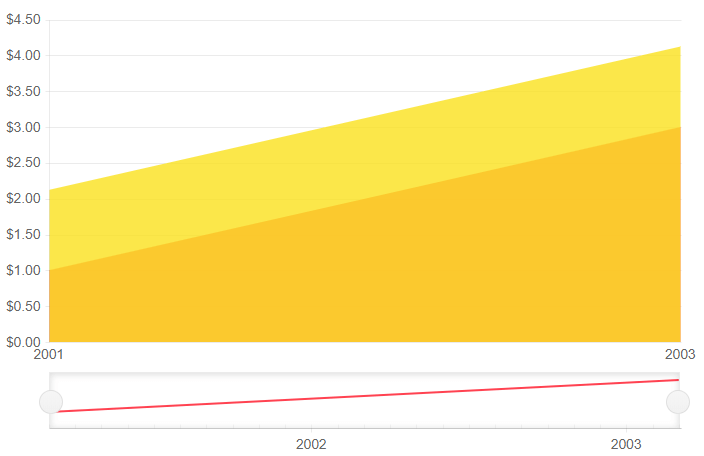
Change the rendering Step and Color of the Category Axis Labels
@* Change the rendering Step and Color of the Category Axis Labels *@

<TelerikStockChart Height="450px"
                   Width="700px">

    <StockChartCategoryAxes>
        <StockChartCategoryAxis BaseUnit="@ChartCategoryAxisBaseUnit.Years">
            <StockChartCategoryAxisLabels Step="1" Color="#0000FF"></StockChartCategoryAxisLabels>
        </StockChartCategoryAxis>
    </StockChartCategoryAxes>

    <StockChartSeriesItems>
        <StockChartSeries Type="StockChartSeriesType.Area"
                          Name="Product 1"
                          Data="@Data"
                          Field="@nameof(ChartSeriesData.Product1Sales)"
                          CategoryField="@nameof(ChartSeriesData.Year)">
        </StockChartSeries>

        <StockChartSeries Type="StockChartSeriesType.Area"
                          Name="Product 1"
                          Data="@Data"
                          Field="@nameof(ChartSeriesData.Product2Sales)"
                          CategoryField="@nameof(ChartSeriesData.Year)">
        </StockChartSeries>
    </StockChartSeriesItems>

    <StockChartNavigator>
        <StockChartNavigatorSeriesItems>
            <StockChartNavigatorSeries Type="StockChartSeriesType.Line"
                                       Name="Product 1"
                                       Data="@Data"
                                       Field="@(nameof(ChartSeriesData.Product1Sales))"
                                       CategoryField="@(nameof(ChartSeriesData.Year))">
            </StockChartNavigatorSeries>
        </StockChartNavigatorSeriesItems>
    </StockChartNavigator>

</TelerikStockChart>

@code {
    public List<ChartSeriesData> Data { get; set; }

    protected override void OnInitialized()
    {
        Data = ChartSeriesData.GenerateData();
    }

    public class ChartSeriesData
    {
        public int Product1Sales { get; set; }
        public double Product2Sales { get; set; }
        public DateTime Year { get; set; }
        public string SegmentName { get; set; }

        public static List<ChartSeriesData> GenerateData()
        {
            List<ChartSeriesData> data = new List<ChartSeriesData>();

            for (int i = 1; i <= 3; i++)
            {
                var dataItem = new ChartSeriesData
                {
                    Product1Sales = i,
                    Product2Sales = i + 1.123,
                    Year = new DateTime(2000 + i, 3, i),
                    SegmentName = $"{i * 100}"
                };

                data.Add(dataItem);
            }

            return data;
        }
    }
}
The result from the code snippet above