ASP.NET Core Chart Overview
The Telerik UI Chart TagHelper and HtmlHelper for ASP.NET Core are server-side wrappers for the Kendo UI Chart widget. To add the component to your ASP.NET Core app, you can use either.
The Chart uses modern browser technologies to render high-quality data visualizations. All graphics are rendered on the client by using Scalable Vector Graphics (SVG) with a fallback to Canvas. The Charts support a set of series types such as Bar, Line, Area, Bullet, Pie, Scatter, Bubble, Polar, and others.
Telerik UI for ASP.NET Core is a
professional grade UI library with 110+ components for building modern and feature-rich applications. To try it out sign up for a free 30-day trial.
![]()
New to Telerik UI for ASP.NET Core?
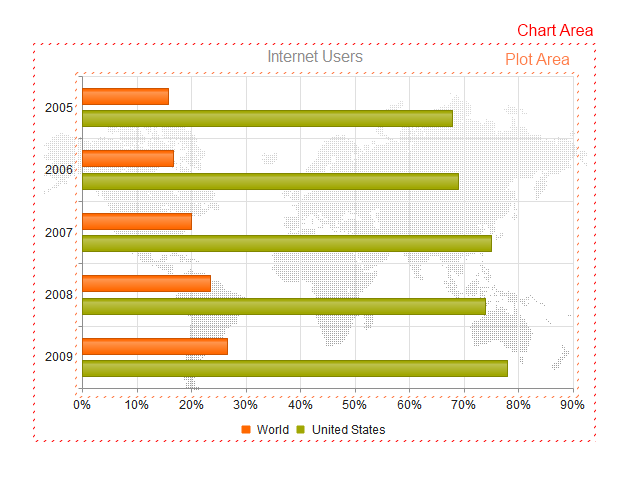
The following image displays the structure of the Chart.
To see the component in action, check the examples:
Initializing the Chart
The following example demonstrates how to define the Chart.
   @(Html.Kendo().Chart(Model)
      .Name("internetUsersChart") // The name of the Chart is mandatory. It specifies the "id" attribute of the widget.
      .Title("Internet Users")
      .Series(series => {
          series.Bar(model => model.Value) // Create a Bar Chart series bound to the "Value" property.
                .Name("United States");
      })
      .CategoryAxis(axis => axis
          .Categories(model => model.Year)
      )
    )
    @addTagHelper *, Kendo.Mvc
    <kendo-chart name="internetUsersChart">
        <category-axis>
            <category-axis-item field="Year">
            </category-axis-item>
        </category-axis>
        <series>
            <series-item type="ChartSeriesType.Bar"
                        field="Value"
                        name="United States">
            </series-item>
        </series>
        <chart-title text="Internet Users">
        </chart-title>
    </kendo-chart>
    public ActionResult Index()
    {
        return View(ChartDataRepository.InternetUsers());
    }
The Chart contains the following building block elements:
| Element | Description |
|---|---|
| Title | The Chart provides extensive configuration options for its title. See the client-side properties for the Title of the Chart component. |
| Legend | The Chart provides extensive configuration options for its legend. See the client-side properties for the Legend of the Chart. |
| Chart area | The chart area represents the entire visible area of the Chart. See the client-side properties for the Chart Area of the Chart component. |
| Plot Area | The plot area displays the series in the Chart. See the client-side properties for the Plot Area of the Chart component. |
| Axis defaults | The Chart provides default options that are valid for all Chart axes. This element accepts the options supported by categoryAxis, valueAxis, xAxis, and yAxis. |
| Series | The Chart provides various configuration options for its series. The series type is determined by the value of the type field. If a type value is missing, the type is assumed to be the one specified in seriesDefaults. |
Basic Configuration
To configure the Chart, pass the configuration options as attributes:
@(Html.Kendo().Chart()
    .Name("chart")
    .Title("Gross domestic product growth /GDP annual %/")
    .Legend(legend => legend
        .Position(ChartLegendPosition.Top)
    )
    .ChartArea(chartArea => chartArea
        .Background("transparent")
    )
    .Series(series =>
    {
        series.Column(new double[] { 3.907, 7.943, 7.848, 9.284, 9.263, 9.801, 3.890, 8.238, 9.552, 6.855 }).Name("India");
        series.Column(new double[] { 4.743, 7.295, 7.175, 6.376, 8.153, 8.535, 5.247, -7.832, 4.3, 4.3 }).Name("Russian Federation");
        series.Column(new double[] { 0.010, -0.375, 1.161, 0.684, 3.7, 3.269, 1.083, -5.127, 3.690, 2.995 }).Name("Germany");
        series.Column(new double[] { 1.988, 2.733, 3.994, 3.464, 4.001, 3.939, 1.333, -2.245, 4.339, 2.727 }).Name("World");
    })
    .CategoryAxis(axis => axis
        .Name("series-axis")
        .Line(line => line.Visible(false))
    )
    .CategoryAxis(axis => axis
        .Name("label-axis")
        .Categories("2002", "2003", "2004", "2005", "2006", "2007", "2008", "2009", "2010", "2011")
    )
    .ValueAxis(axis => axis
        .Numeric()
            .Labels(labels => labels.Format("{0}%"))

            // Move the label-axis all the way down the value axis.
            .AxisCrossingValue(0, int.MinValue)
    )
    .Tooltip(tooltip => tooltip
        .Visible(true)
        .Format("{0}%")
        .Template("#= series.name #: #= value #")
    )
)
@addTagHelper *, Kendo.Mvc

<kendo-chart name="chart">
    <chart-title text="Gross domestic product growth /GDP annual %/"></chart-title>
    <chart-legend position="ChartLegendPosition.Top"></chart-legend>
    <series-defaults type="ChartSeriesType.Column"></series-defaults>

    <series>
        <series-item name="India" data="new double[] { 3.907, 7.943, 7.848, 9.284, 9.263, 9.801, 3.890, 8.238, 9.552, 6.855 }"></series-item>
        <series-item name="Russian Federation" data="new double[] { 4.743, 7.295, 7.175, 6.376, 8.153, 8.535, 5.247, -7.832, 4.3, 4.3 }"></series-item>
        <series-item name="Germany" data="new double[] { 0.010, -0.375, 1.161, 0.684, 3.7, 3.269, 1.083, -5.127, 3.690, 2.995 }"></series-item>
        <series-item name="World" data="new double[] { 1.988, 2.733, 3.994, 3.464, 4.001, 3.939, 1.333, -2.245, 4.339, 2.727 }"></series-item>
    </series>

    <value-axis>
        <value-axis-item>
            <labels format="{0}%"></labels>
            <line visible="false" />
        </value-axis-item>
    </value-axis>

    <category-axis>
        <category-axis-item categories='new string[] { "2002", "2003", "2004", "2005", "2006", "2007", "2008", "2009", "20010", "2011", }'>
            <labels position="ChartAxisLabelsPosition.Start" />
            <line visible="false" />
        </category-axis-item>
    </category-axis>

    <tooltip visible="true" format="{0}%" template="#= series.name #: #= value #"></tooltip>
</kendo-chart>
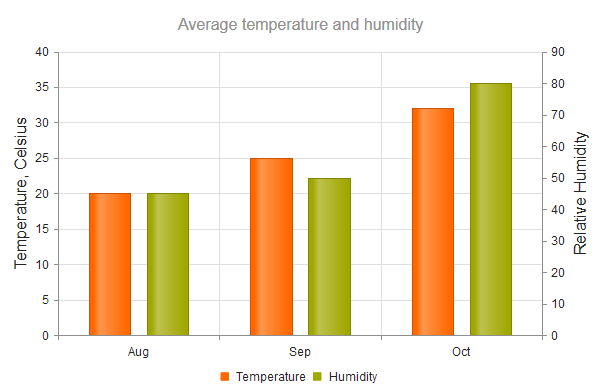
Axis Title
You can also add a title to clearly indicate the role of the axis.
    @(Html.Kendo().Chart()
        .Name("chart")
        .Title("Average temperature and humidity")
        .Legend(legend => legend
            .Position(ChartLegendPosition.Bottom)
        )
        .Series(series => {
            series.Column(new double[] { 20, 25, 32 }).Name("Temperature").Axis("temperature");
            series.Column(new double[] { 45, 50, 80 }).Name("Humidity").Axis("humidity");
        })
        .CategoryAxis(axis => axis
            .Categories("Aug", "Sep", "Oct")
            .AxisCrossingValue(0, 3)
        )
        .ValueAxis(axis => axis
            .Numeric()
            .Name("temperature")
            .Title(t=>t.Text("Temperature, Celsius"))
        )
        .ValueAxis(axis => axis
            .Numeric()
            .Name("humidity")
            .Title(t=>t.Text("Relative Humidity"))
        )
    )
    @addTagHelper *, Kendo.Mvc
    @{
        var categories = new string[] { "Aug", "Sep", "Oct" };
    }
    <kendo-chart name="chart">
        <category-axis>
            <category-axis-item categories="categories"
                                axis-crossing-value="new object[] { 0, 3}">
            </category-axis-item>
        </category-axis>
        <series>
            <series-item type="ChartSeriesType.Column"
                        axis="temperature"
                        name="Temperature"
                        data="new double[] { 20, 25, 32 }">
            </series-item>
            <series-item type="ChartSeriesType.Column"
                        axis="humidity"
                        name="Humidity"
                        data="new double[] { 45, 50, 80 }">
            </series-item>
        </series>
        <value-axis>
            <value-axis-item name="temperature" type="numeric">
                <chart-value-axis-item-title text="Temperature, Celsius">
                </chart-value-axis-item-title>
            </value-axis-item>
            <value-axis-item name="humidity" type="numeric">
                <chart-value-axis-item-title text="Relative Humidity">
                </chart-value-axis-item-title>
            </value-axis-item>
        </value-axis>
        <chart-legend position="ChartLegendPosition.Bottom">
        </chart-legend>
        <chart-title text="Average temperature and humidity">
        </chart-title>
    </kendo-chart>
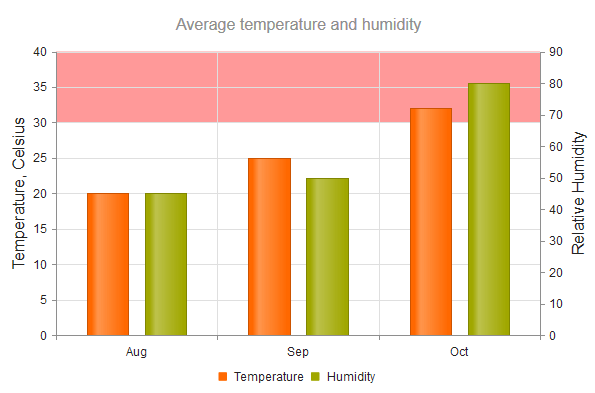
Plot Bands
The Chart enables you to configure each axis to display bands with different colors for predefined value ranges. The category index (zero-based) is used as a value for the category axis.
    .ValueAxis(axis => axis.Numeric()
        .Labels(labels => labels.Format("{0:N0}"))
        .MajorUnit(10000)
        .Max(70000)
        .Line(line => line.Visible(false))
        .PlotBands(bands => {
            bands.Add().From(10000).To(30000).Color("#c00").Opacity(0.3);
            bands.Add().From(30000).To(30500).Color("#c00").Opacity(0.8);
        })
    )
    <value-axis-item type="numeric"
                        major-unit="10000"
                        max="70000">
        <labels format="{0:N0}">
        </labels>
        <line visible="false"/>
        <plot-bands>
            <chart-value-axis-plot-band from="10000"
                                        to="30000"
                                        color="#c00"
                                        opacity="0.3">
            </chart-value-axis-plot-band>
            <chart-value-axis-plot-band from="30000"
                                        to="30500"
                                        color="#c00"
                                        opacity="0.8">
            </chart-value-axis-plot-band>
        </plot-bands>
    </value-axis-item>
Global Settings
You may also need to apply global settings that affect all axes. In such cases, use AxisDefaults.
    .AxisDefaults(a=> a
        .Labels(l=>l.Font("16px Verdana"))
    )
    <axis-defaults>
        <labels font="16px Verdana">
        </labels>
    </axis-defaults>
Functionality and Features
- Data binding—You can populate the Telerik UI Chart for ASP.NET Core with data by binding it to inline data, local data, or remote data.
- Appearance—Unlike other Telerik UI for ASP.NET Core components which use only CSS for styling, you can control the appearance of the Chart elements primarily by using JavaScript style options.
- No Data Template—The Chart for ASP.NET Core allows you to display a message when there is no data to show. Here’s how to set up a custom message for scenarios where the chart data is unavailable.
- Series Patterns—The Telerik UI Chart component for ASP.NET Core offers customization options for presenting data visually, including support for using patterns in chart series.
Chart Types
The Telerik UI for ASP.NET Core Chart supports an extensive set of series types.
| Chart type | Description |
|---|---|
| Categorical Charts | Categorical Charts use a single category axis and a single value axis. |
| Scatter Charts | Scatter Charts display data as points that are defined by the values of their items. |
| Area Charts | Area Charts display quantitative data by using continuous lines that pass through points defined by the values of their items. |
| Bar Charts | Bar Charts display data using horizontal or vertical bars whose length varies according to their values. |
| Box Plot Charts | Box Plot Charts are useful for displaying variations in statistical samples of data and data details in a small space. |
| Bubble Charts | Bubble Charts display data as points with coordinates and sizes determined by the values of their items. |
| Bullet Charts | Bullet Charts represent a variation of the Bar Chart. |
| Funnel Charts | Funnel Charts are suitable for representing stages in a sales process and for showing the amount of the potential revenue from each stage. |
| Line Charts | Line Charts are suitable for displaying quantitative data by using continuous lines passing through points defined by the values of their items. |
| Pie Charts | Pie Charts display data as single-series sectors from a two-dimensional circle which is useful for rendering data as a part of the whole. |
| Polar Charts | Polar Charts represent the relationships between data points in terms of radiuses and angles in a circular coordinate system. |
| Donut Charts | Donut Charts are a Pie chart variation with the ability to display data as single-series sectors from a two-dimensional circle. |
| StockChart | StockCharts visualize the price movement of any financial instrument over a certain period. |
Referencing Existing Instances
To reference an existing Chart instance, use the jQuery.data() configuration option. Once a reference is established, use the Chart client-side API to control its behavior.
    // Place the following after the Chart for ASP.NET Core declaration.
    <script>
        $(function() {
            // The Name() of the Chart is used to get its client-side instance.
            var chart = $("#internetUsersChart").data("kendoChart");
        });
    </script>