Using the Visual Debugger
What is the Visual Debugger?
The Visual Debugger is a set of options for debugging a test while test execution is paused. These options allow you to navigate a test, view debugging information for the current step, and report bugs.
When to use the Visual Debugger
The Visual Debugger is helpful in situations where a test does not behave as expected, especially when it is not clear at which step a particular problem occurred. It is also helpful for slowing down test execution and observing test behavior step by step.
First, you can use the visual debugger to help identify why a step did not act upon the correct element. This includes diagnosing:
‘Element does not exist’ exceptions;
‘Element not found’ exceptions;
‘Timed out waiting for element’ exceptions.
Even if a test step passes, you can still use the visual debugger to analyze its behavior.
Lastly, you can use the Visual Debugger to record instances in which your target application behaves unexpectedly.
How to use the Visual Debugger
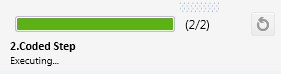
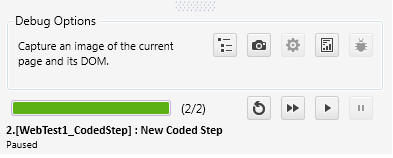
The most commonly used feature of the Visual Debugger is the step status message and progress bar, which show which step is being executed, the description of that step, and what fraction of the test steps have completed. Keep your eye on this to help follow any test execution in Test Studio. This way, if you find a problem with one of your test steps, you will know which step to change.

The bottom row of buttons provides options for controlled execution of the test. The Visual Debugger allows you to replay steps and move through your test one step at a time. This is helpful for careful observation of test behavior. Specifically, it can help identify which test step is putting the target application in a particular state.

The top row of buttons provides options for analyzing and recording information about the current test step.
‘Open the DOM Explorer’ displays the DOM Explorer for the currently displayed page. This can help identify the correct find logic for a particular element, or whether a desired element is missing.
‘Capture an image of the current page and its DOM creates a complete record of the current state of the application. You can use this record to compare to the find logic for the step, or to communicate the state of the application to a third party, such as a developer or Test Studio support engineer.
‘Diagnose the currently failed step’ shows the find logic for the current step. In combination with the DOM Explorer, this find logic can help diagnose steps that fail due to faulty find expressions.
‘View the current execution log’ displays the execution log at the time of the current step. Since the execution log contains details on step failure, it can act as a starting point in your debugging. For example, if the failure log contains an ‘Element does not exist’ exception, you can check to see if the element is missing altogether or whether the step used bad find logic.
‘Submit Bug’ opens the Submit a Bug dialog, so you can easily record any bugs in the target application during debugging.