Implement a Common Master-Detail Report Scenario
In this step-by-step tutorial, we will improve the basic report created in the previous tutorial Embedding the Web Report Designer in .NET 8 and Creating Your First Report by adding a common business requirement to click a data series to show more details in a child report.
- First, we will create a second report to display the detailed data.
- Then, we will learn how to add a SharedDataSource component to share a data source between reports.
- Next, we will add and configure a PieChart to the detailed report.
- Finally, we will learn how to add a Drillthrough/Navigate To Report Action to the master report Column Chart.
- At the end, we will have a master report able to navigate to a child report with detailed data for the selected Product Category.
Creating a Child Report
Our first goal is to create a new report within the Web Report Designer. It will serve as a child report for displaying the detailed data for the selected category from the main report we created previously:
-
Go to the main toolbar
Menuand selectNew Report. TheCreate Reportdialog opens:- Let's name the report
SalesBySubcategory. - Let it be a
TRDPreport as the main one. - Enter the same
Locationthat is the Demo subfolder. - Click
Saveto apply the settings.
- Let's name the report
We'll remove the Page Header and Footer sections again.
-
We can add the same Report Header as in the main report. We will copy it from the latter:
- Search for the
report headerin the Search box and add it to the child report. - If necessary, increase its Height.
- Go to the main report and select
PictureBoxandTextBoxfrom its Report Header. -
Open the
Context menuby clicking on the ellipses (...) beside the selected items in theExplorertab of the Menu. SelectCopyto copy the items.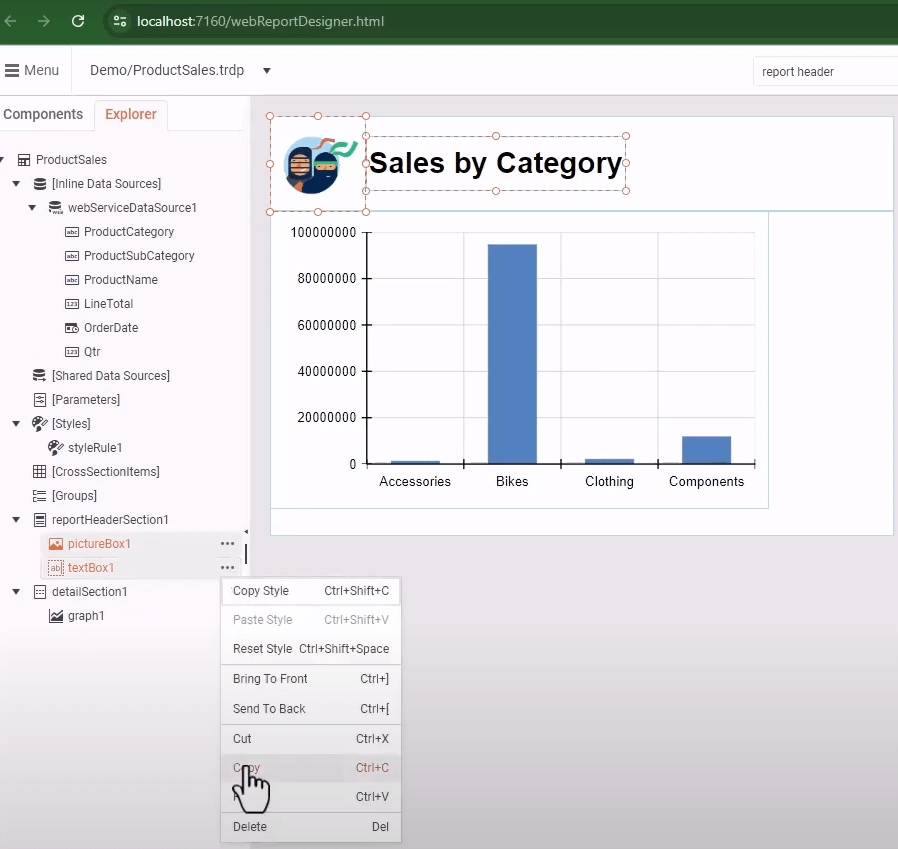
-
Return to the child report, select the Report Header, and invoke its
Context menutoPastethe selected items.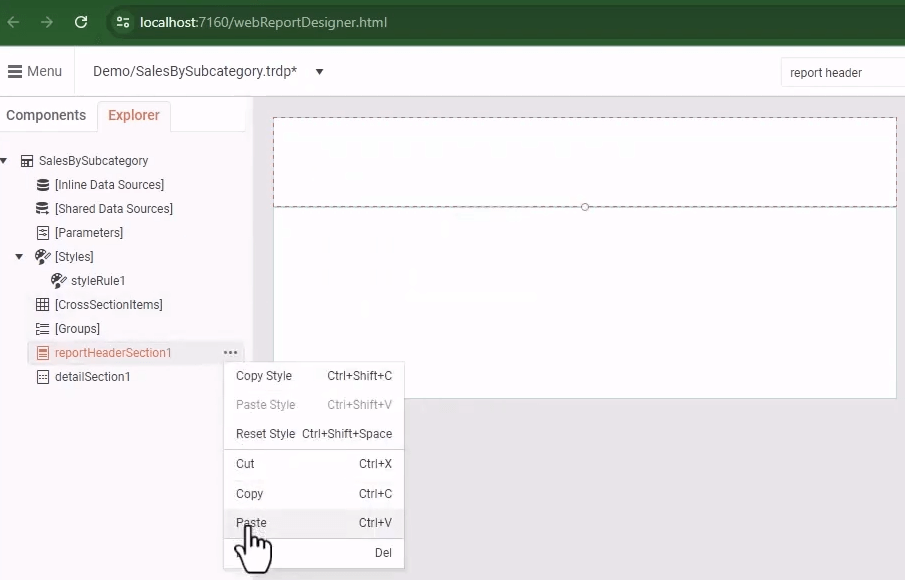
Adjust the pasted items' positions, if necessary.
- Search for the
-
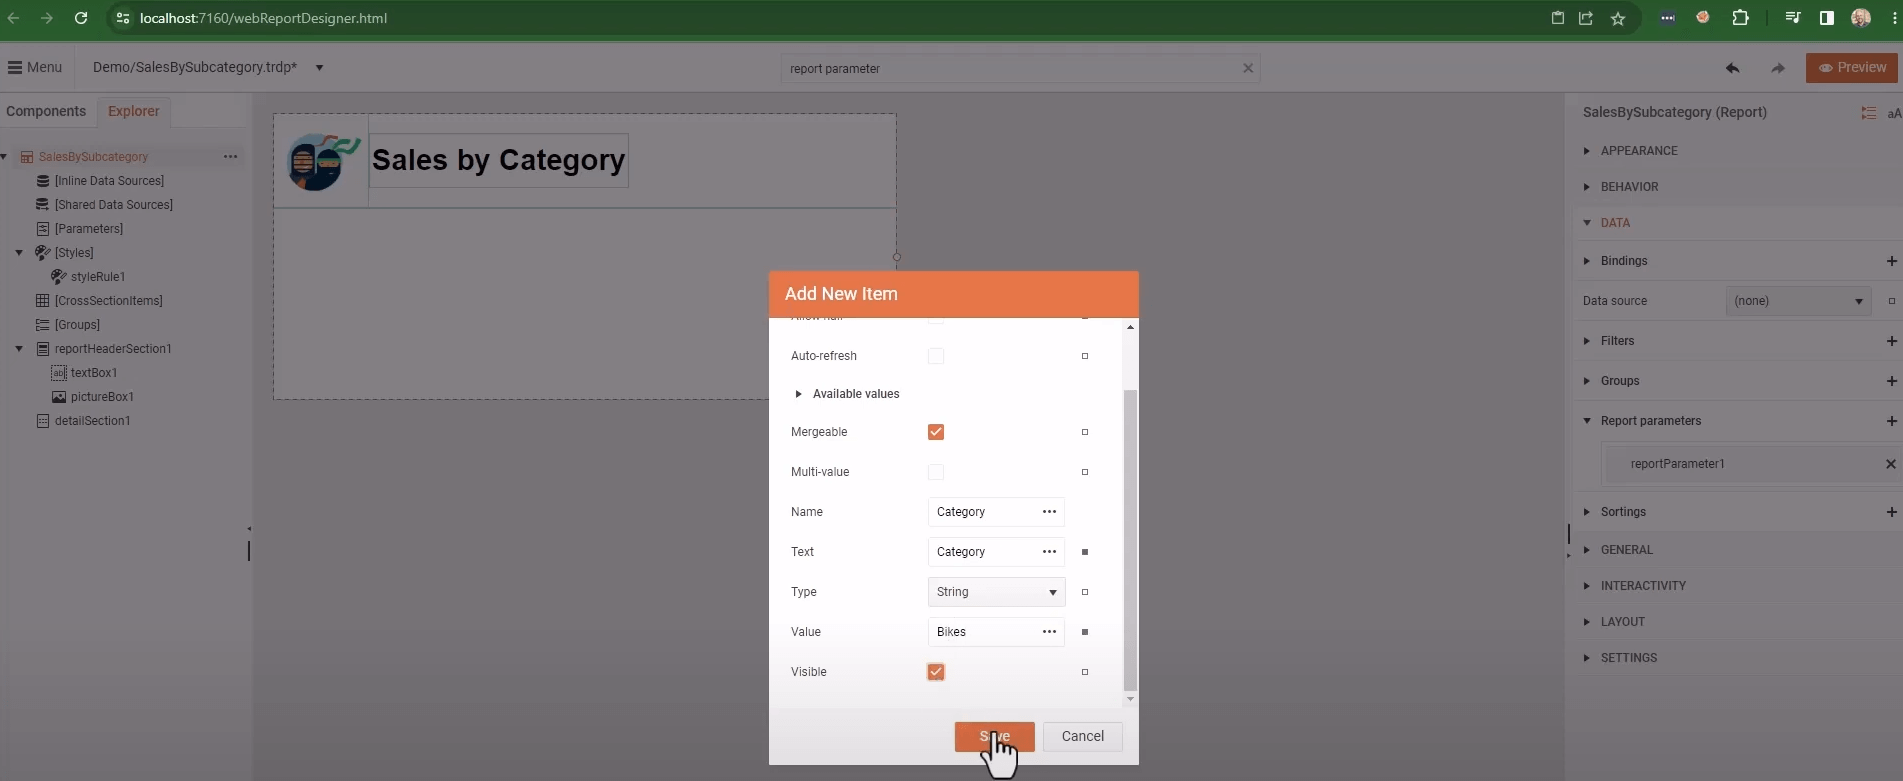
Next, we'll add a Report Parameter that will receive the Category from the parent report.
We will use the parameter to filter the data from the WebServiceDataSource.
- Search for the
report parameterin the Search box. - Select
+to open theAdd New Itemdialog that lets you add a new parameter to the collection. - Let's name the parameter
Categoryand use the same for theTextproperty. The latter represents the label in the parameter's editor. - We'll add the default
ValueBikes as we know this category exists. - Mark the parameter as
Visiblein the user interface. - Click
Saveto preserve the new parameter settings.
- Search for the
-
Let's update the report title to display the selected category available in the new Report Parameter:
- Select the TextBox in the Report Header.
- Click on the ellipses (...) beside its
Valueproperty in the Property editor. This opens theEdit Valuedialog. - Select the
Report Parametersfrom the list on the left. - Double-click on the
Category Valuefrom the middle list. -
Update the Expression by concatenating a string at the end to become
= Parameters.Category.Value + "Sales by Subcategory".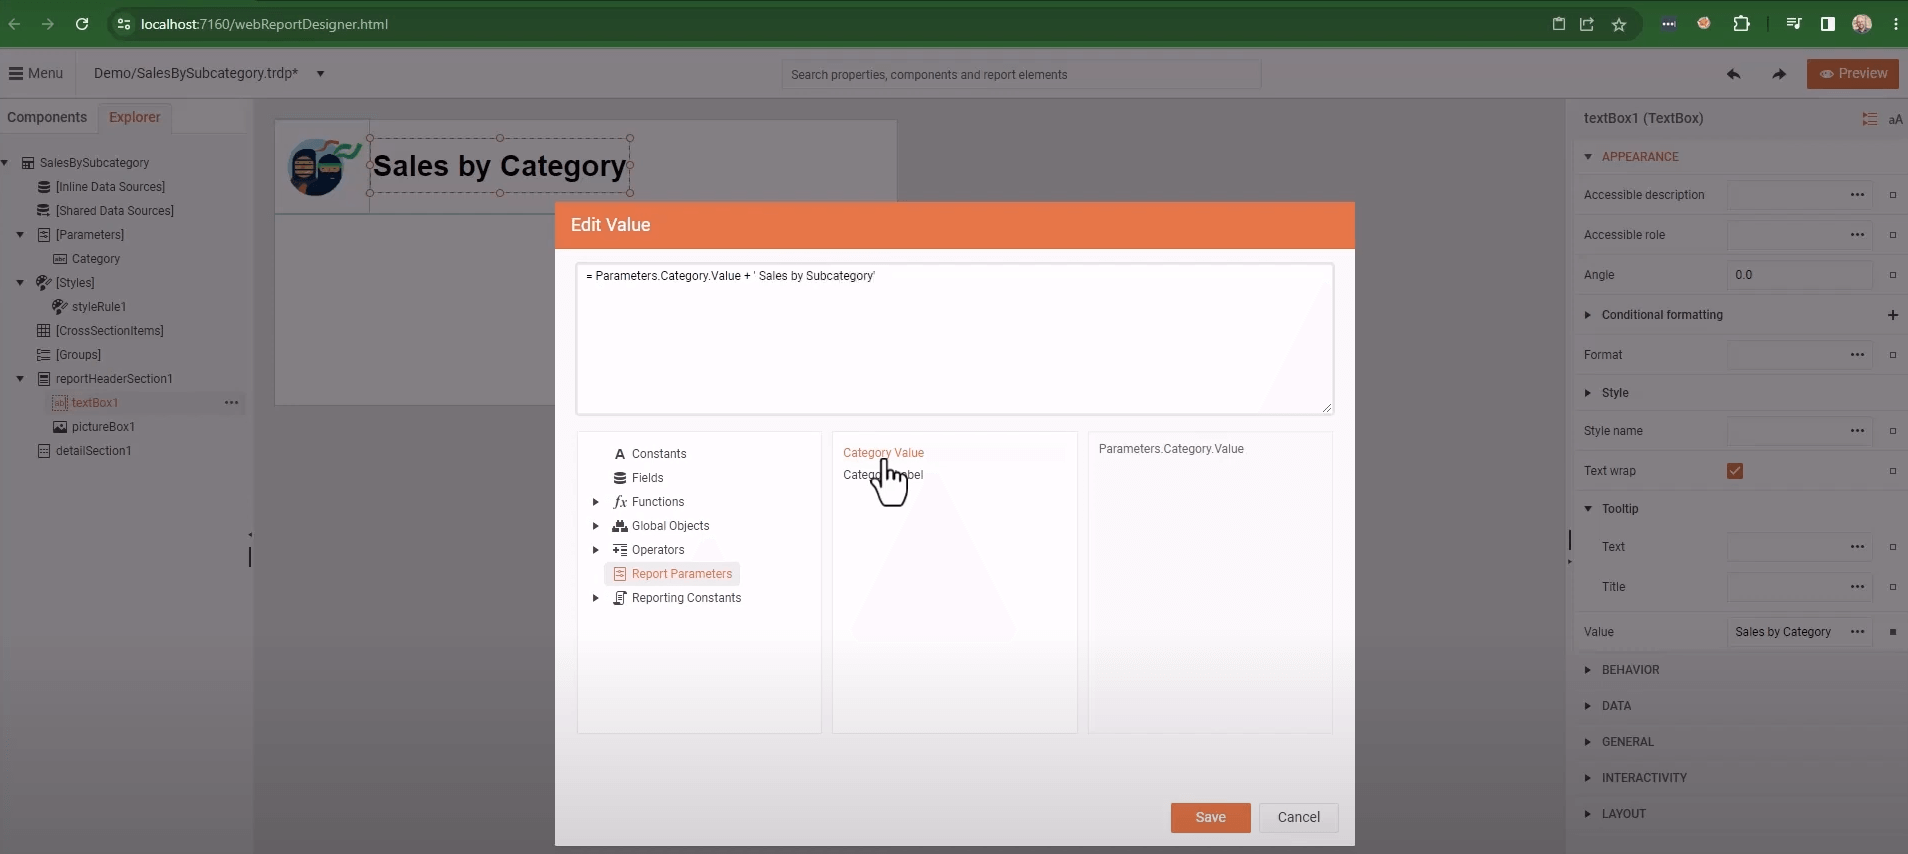
-
SaveandPreviewthe child report. The report should display the default category in the Report Header.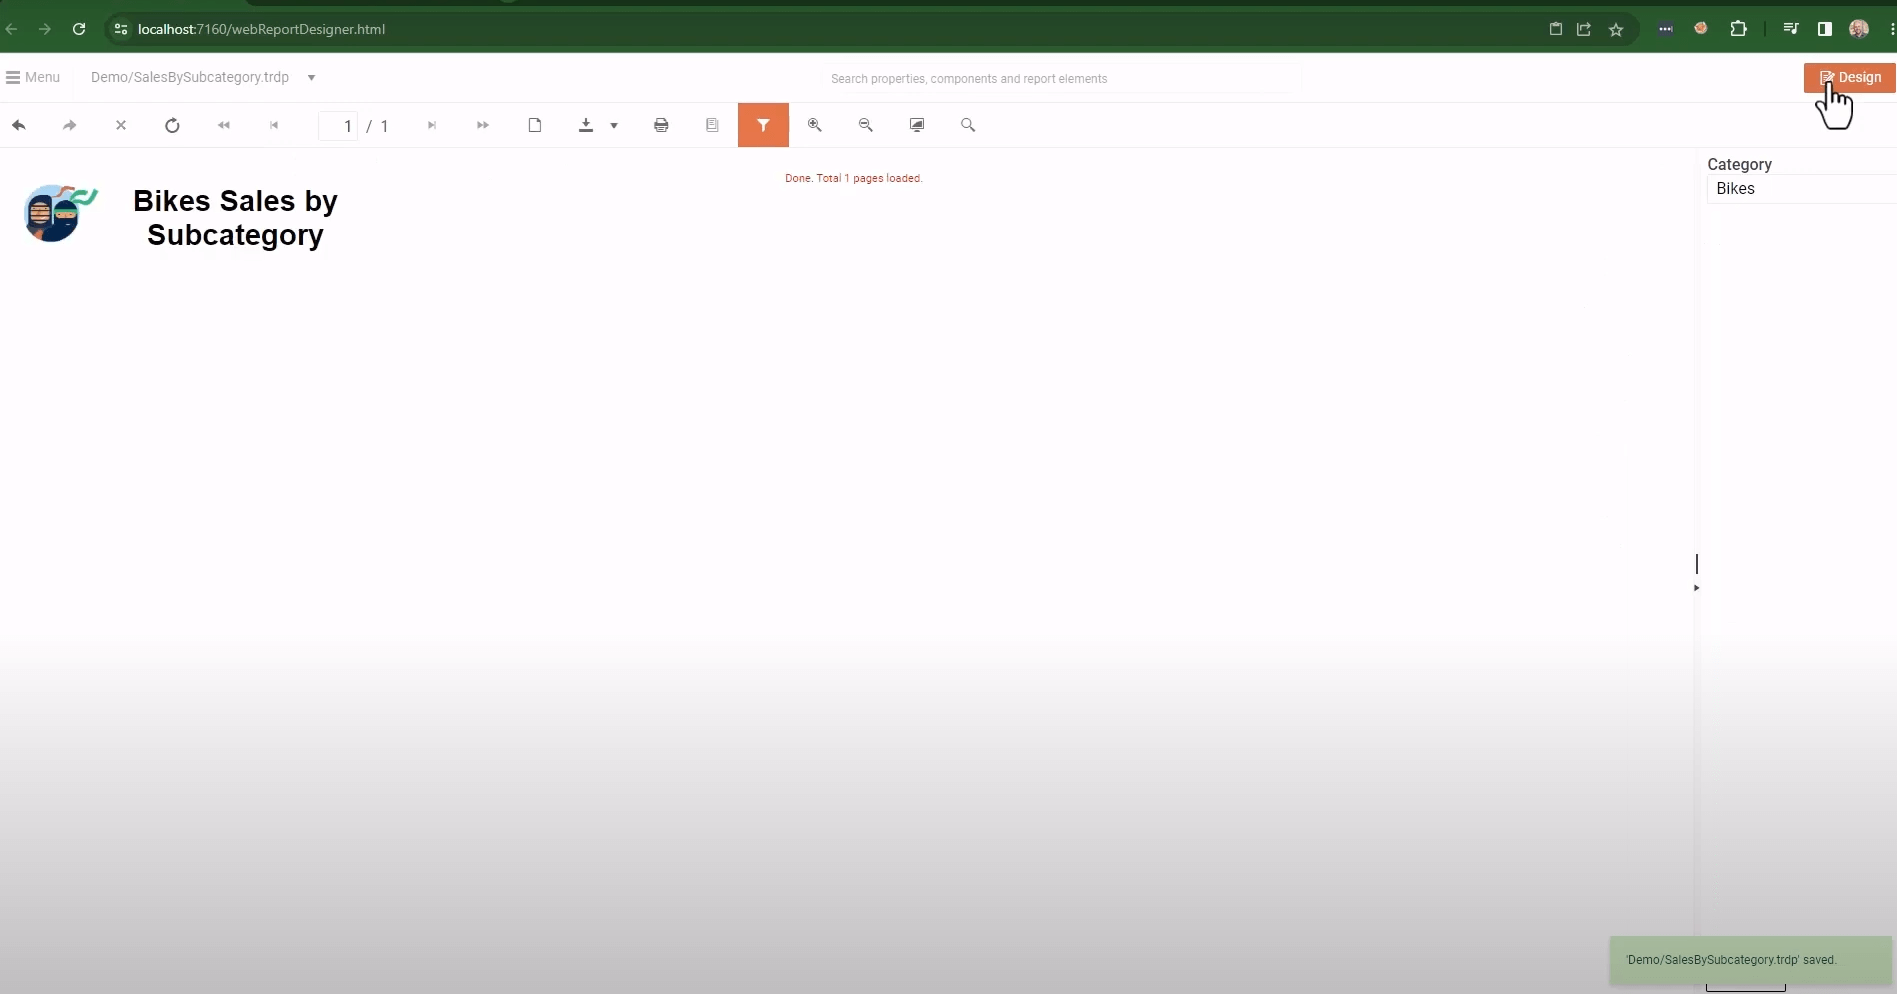
-
Configure the child report to reuse the DataSource from the main report:
-
Convert the
WebServiceDataSourcefrom the main report to a SharedDataSource:- Navigate to the main report.
- Select its WebServiceDataSource from the
Explorertab of the Menu. -
Invoke the
Context menuby clicking on the ellipses (...) and selectingSave As Shared Data Source.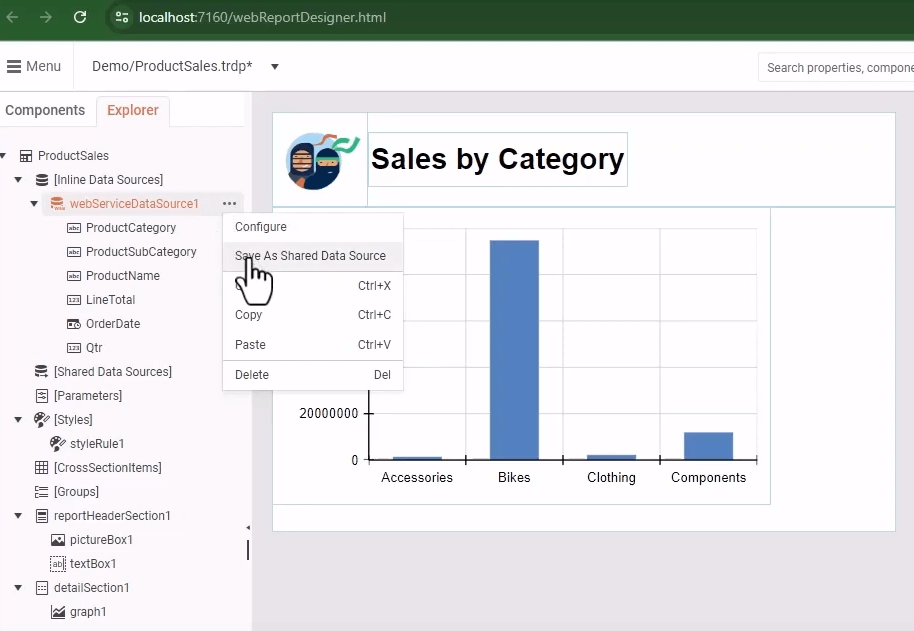
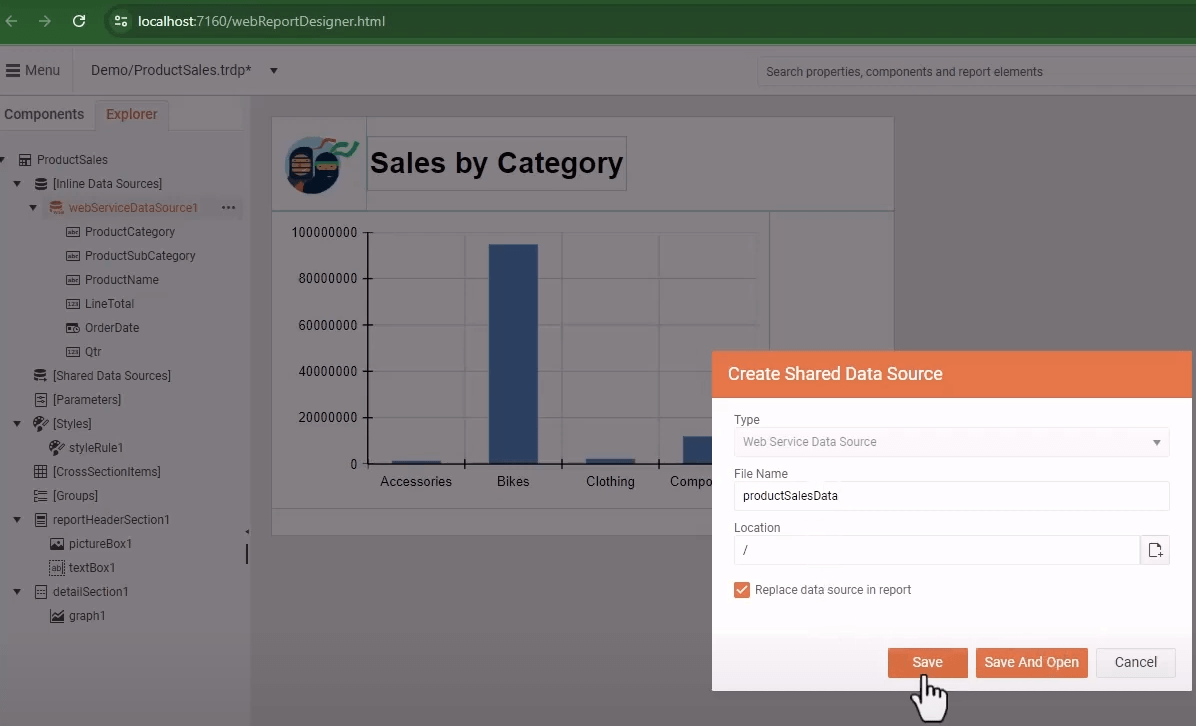
In the opened
Create Shared Data Sourcedialog, name the componentproductSalesDataand check theReplace data source in reportto let both reports use the SharedDataSource that is stored in the Assets manager.- Click
Saveand ensure thewebServiceDataSource1has been moved fromInline Data SourcestoShared Data Sources.
-
Navigate back to the child report.
-
Open the context menu of the
Shared Data Sourcesand selectAdd Existing Shared Data Source.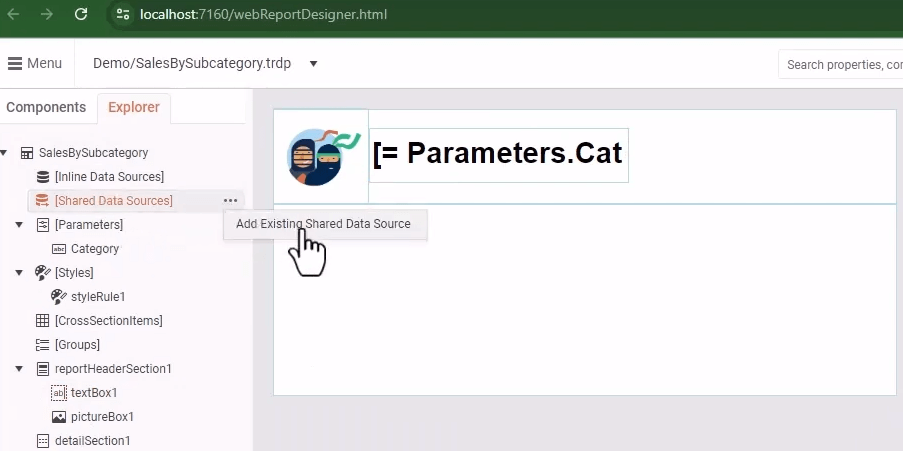
-
In the popped-up
Browse For Folderdialog, selectShared Data Sourceson the left and choose theproductSalesData.sdsxfile, which is our shared data source that we just saved from the main report.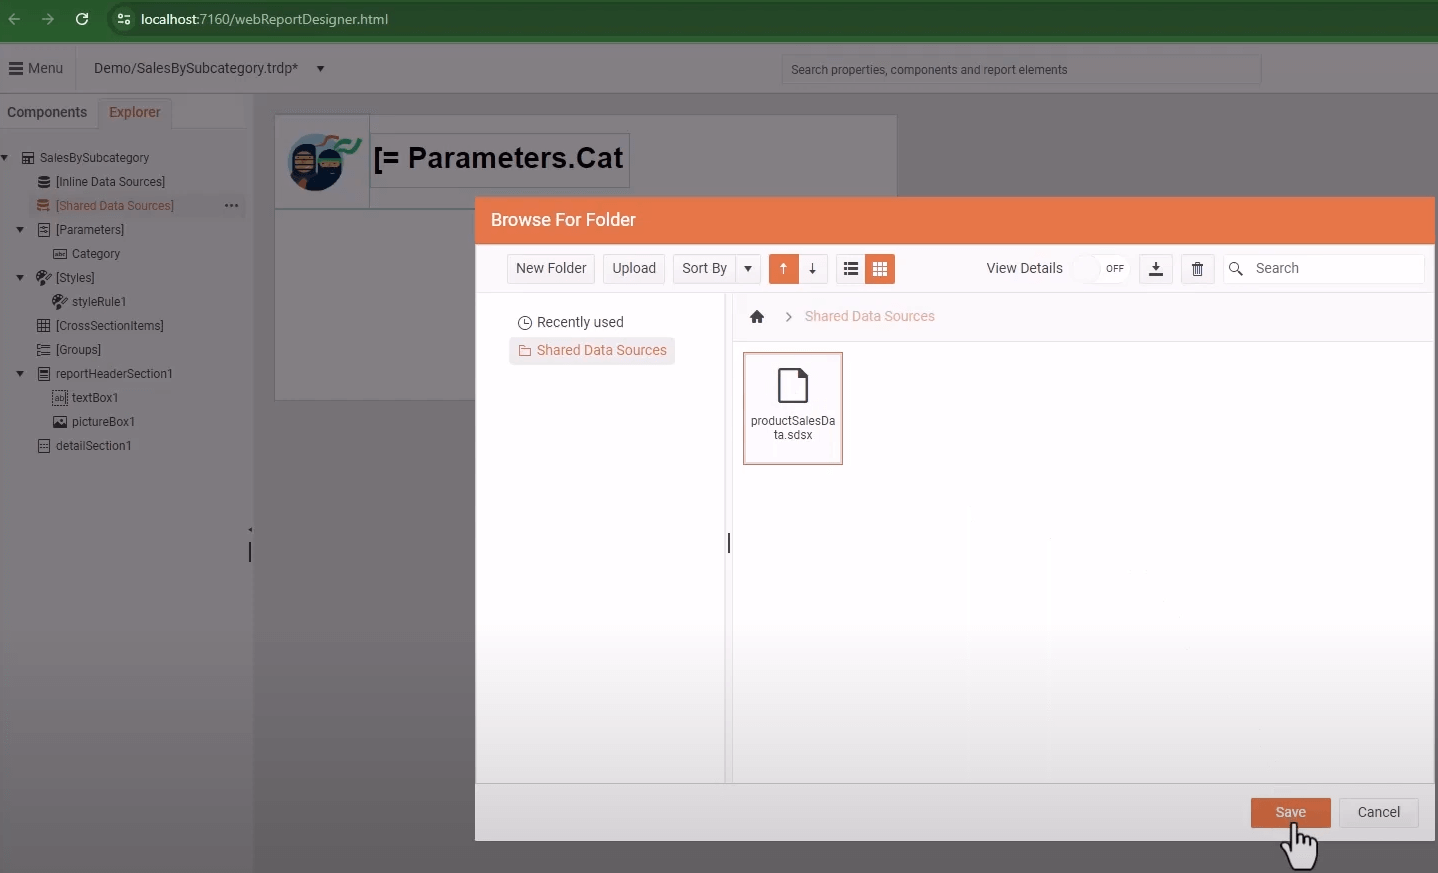
Click
Saveand ensure theproductSalesData1component appears under theShared Data Sourcesof the child report.
-
-
-
Let's use the SharedDataSource to create our Pie Chart:
- Search for
pieto bring up theConfigure Pie Chartpane on the right side of the web report designer. - Select the
Data Source. -
Drag the
ProductSubcategoryfield to theSeriesbox. This way, we will create the Pie Chart slices from the Product SubCategories.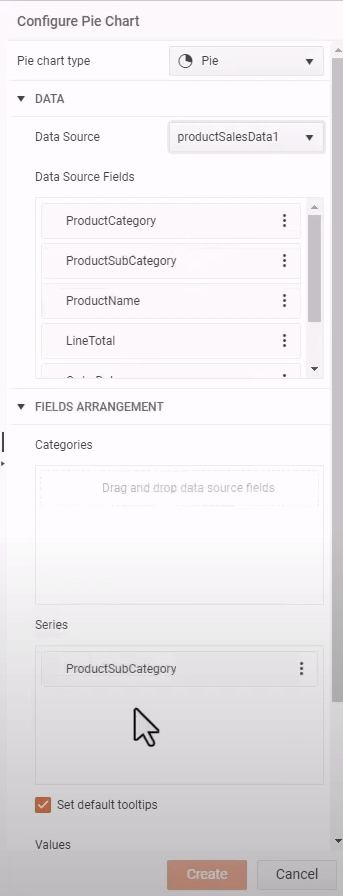
Drag the
LineTotalinto theValuesbox. The aggregate functionSumis automatically applied to the field, so the Values of each Pie slice will be the sum ofLineTotal.-
Click
Createand you should see a Pie Chart that contains all the data from the DataSource.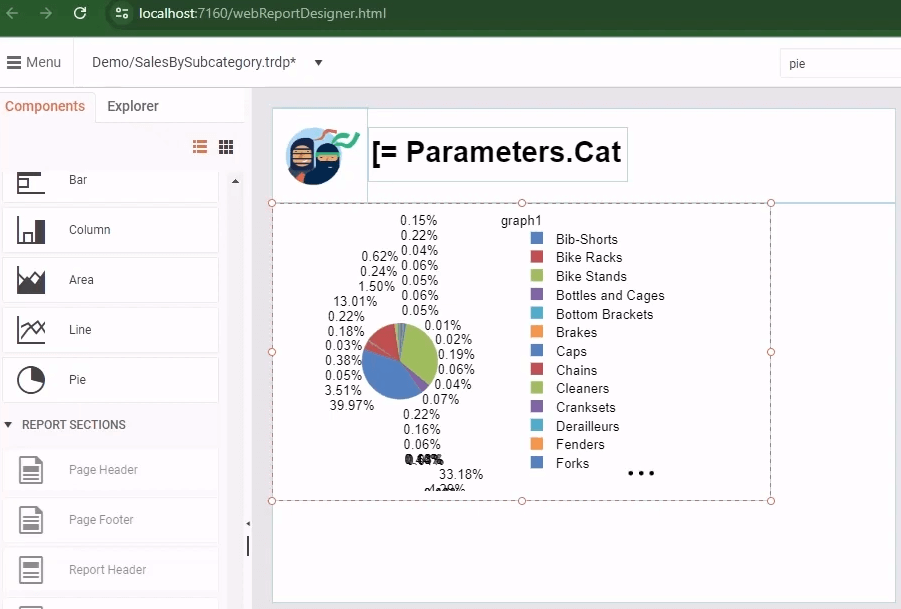
-
Since we want to see only the data for a specific category, we need to add a rule to filter the data based on the value of our report parameter.
- Search for
filtersand add a new filter to the Graph. - Add as an Expression
=Fields.ProductCategory. - Select
Equalas Operator. -
For
Value, enter the value of the report parameter= Parameters.Category.Value.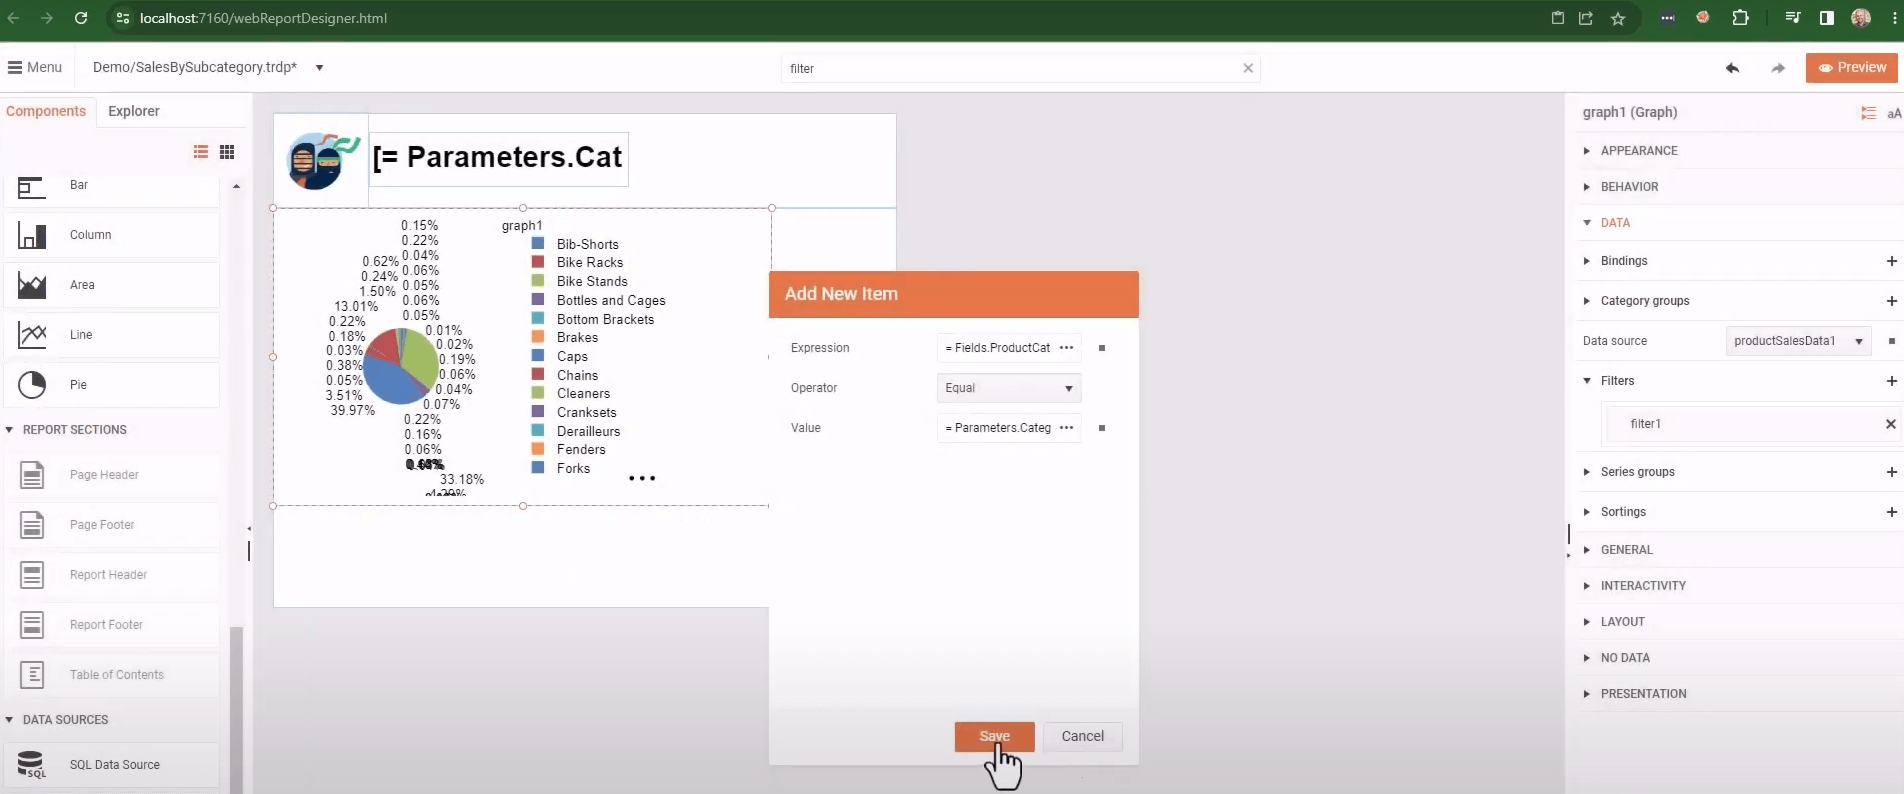
You should see an immediate update for the
Bikescategory since this is the parameter's default value.
- Search for
-
Format the Pie Chart:
- Hide the
Title. -
Update the series by adding
DataPointLabelConnectors:- Check the
DataPointLabelConnectorStyle>Visibleproperty. - Set
DataPointLabelOffsetto5mm. - For
DataPointLabelAlignment, useOutsideColumnfrom the dropdown. - Click
Save.
- Check the
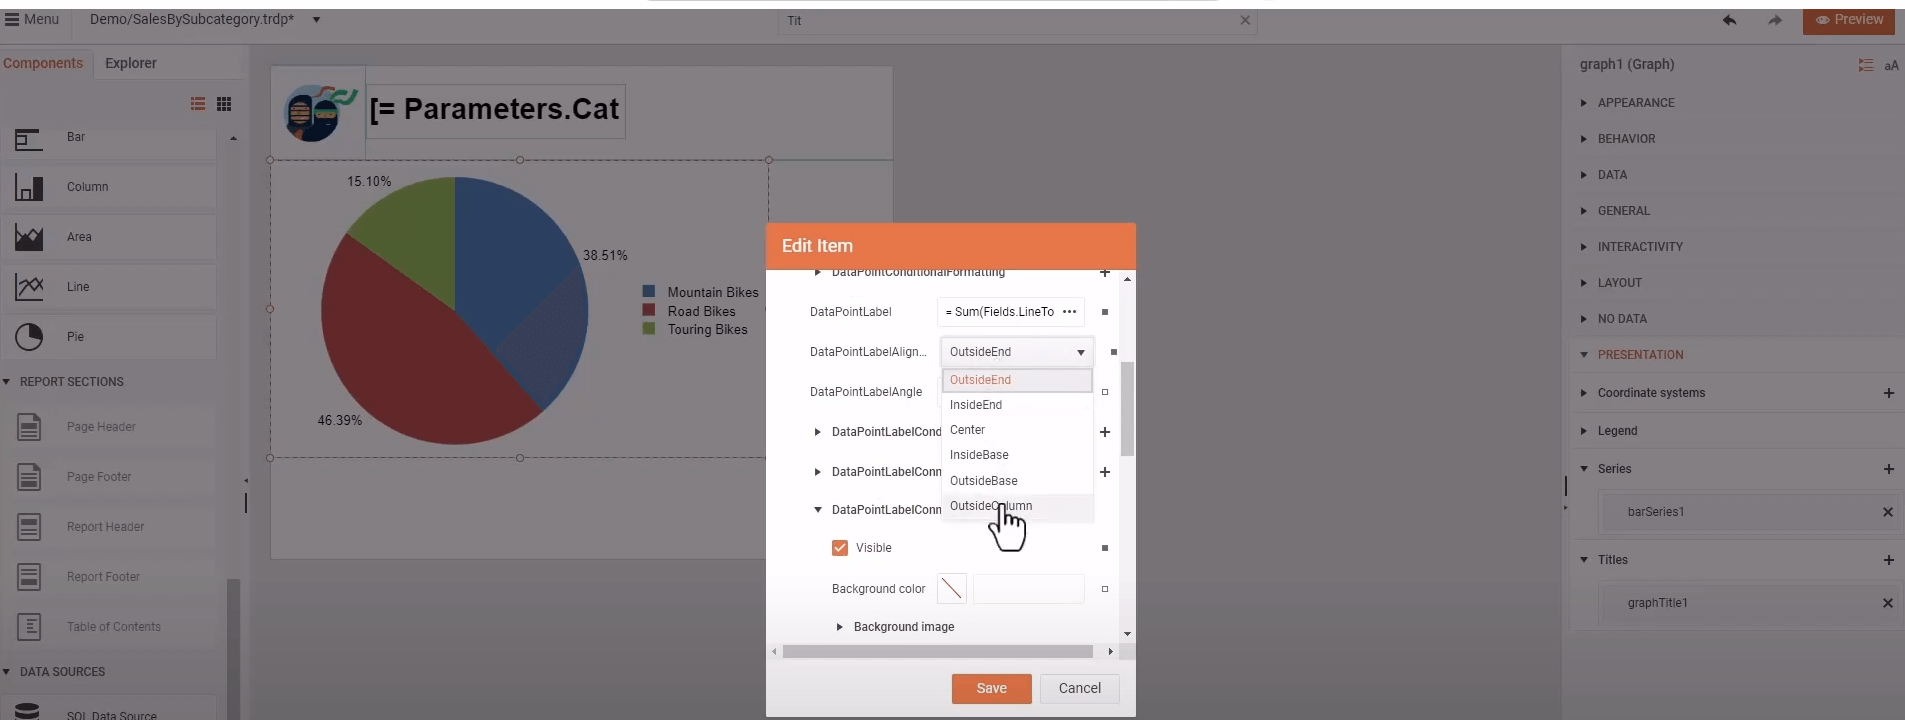
- Hide the
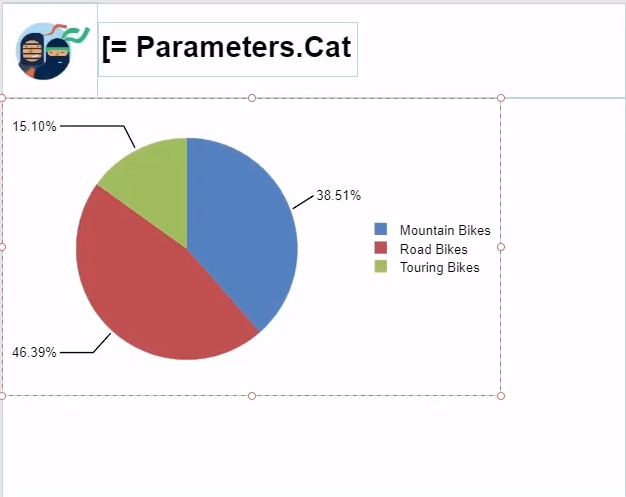
The live preview should display the updated Pie Chart in the
Designview of the Web Report Designer.
- Search for
-
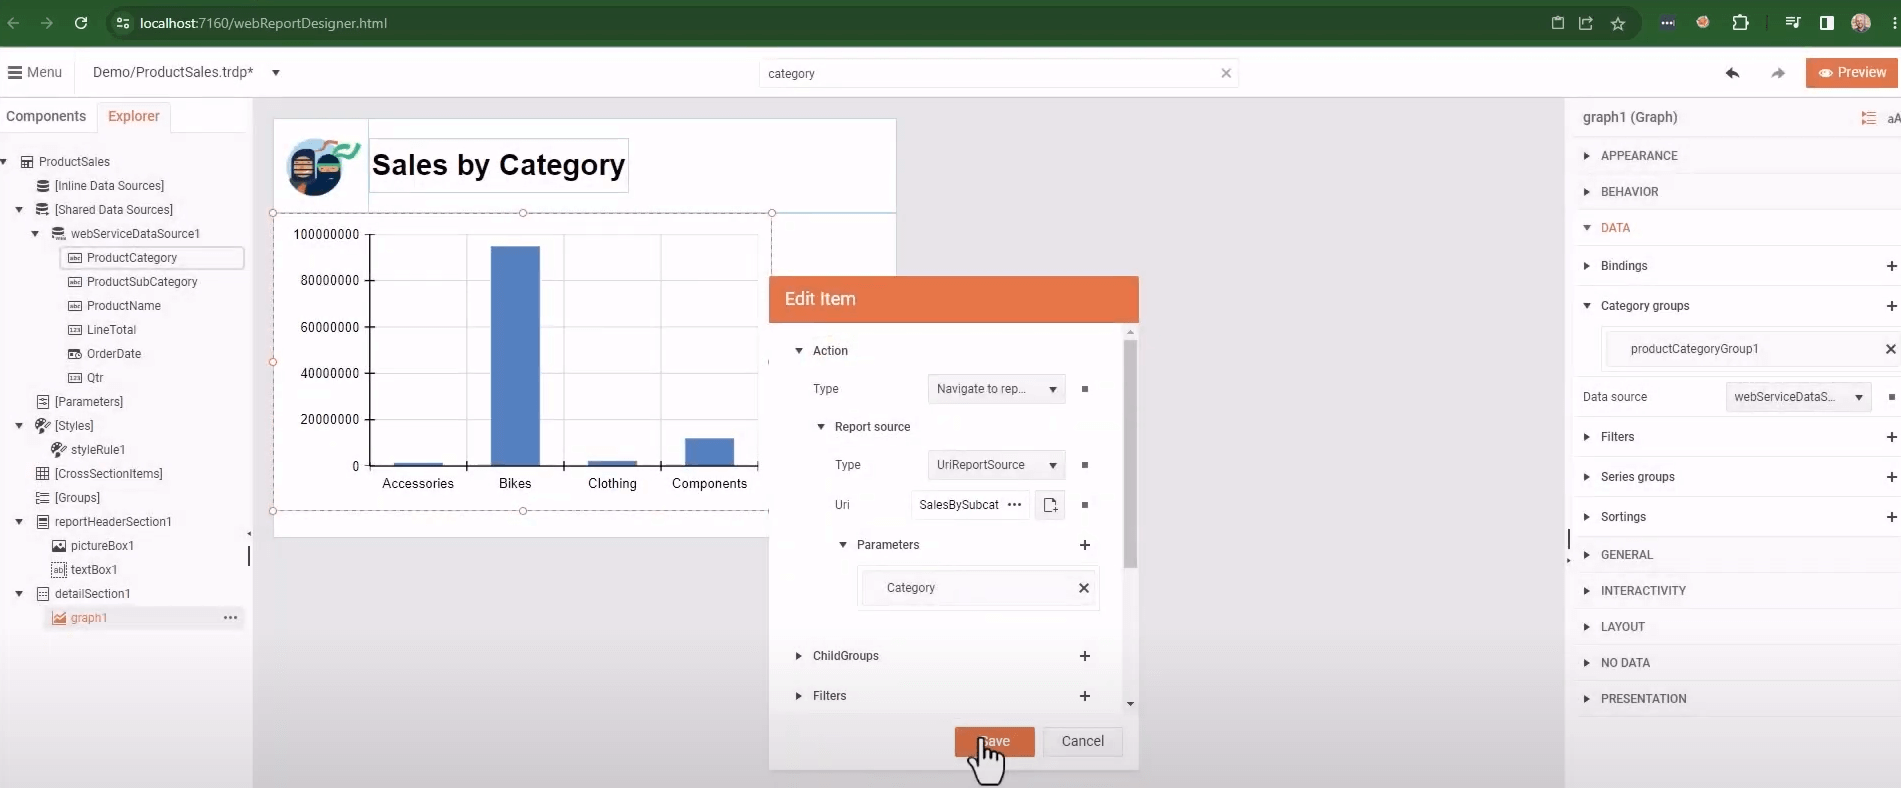
Connect the main and the child report with the Drillthrough Action:
- Navigate to the main report.
- Search for
category groupin the Search box and select theproductCategoryGroup1. - In the
Edit Itemdialog, go toActionand selectNavigate to reportfrom the dropdown. - Set the Report source
Typeto UriReportSource. - Open the Assets manager from the icon next to
Uriand select theSalesBySubcategory.trdpreport from theDemofolder. - Add a new Parameter to the
Parameterscollection of the Report source withNamecorresponding to the child report's parameter, i.e.,Category, andValuebeing the value of the current product category field, i.e.,=Fields.ProductCategory. - Click
Saveto preserve the configuration.
-
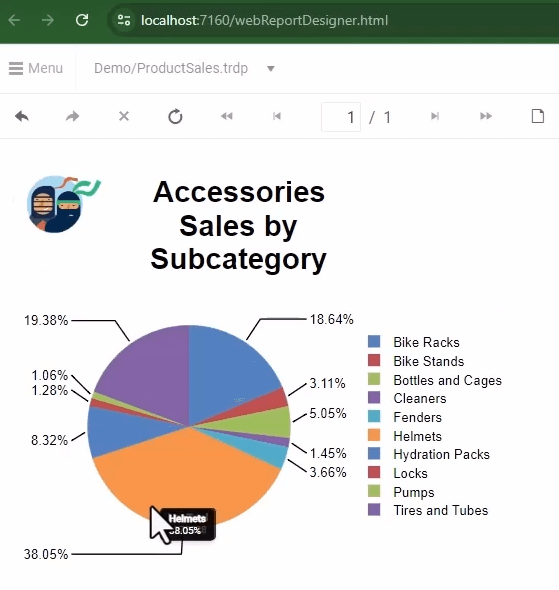
Test how the reports interact:
- Navigate from the main report to the child report by clicking on a particular Product Category column in the Column Chart.
- Navigate back to the main report from the child report through the Viewer's Toolbar button Navigate back in history.
The entire process is demonstrated in the YouTube video tutorial Getting Started with the Web Report Designer: Part 2.
See Also
- Video tutorial 'Getting Started with the Web Report Designer: Part 2'
- Video tutorial 'Getting Started with the Web Report Designer: Part 1'
- Embedding the Web Report Designer in .NET 8 and Creating Your First Report
- Web Report Designer
- Demo Page for Telerik Reporting
- Telerik Reporting Homepage
- Reporting Forums
- Reporting Blog
- Reporting Videos
- Reporting Roadmap
- Reporting Pricing
- Reporting Training