Getting Started with WPF HeatMap
This tutorial will walk you through the creation of a sample application that contains RadHeatMap with a categorical definition.
- Adding Telerik Assemblies Using NuGet
- Adding Assembly References Manually
- Setting up the Data
- Setting up the Control
- Colorization
Adding Telerik Assemblies Using NuGet
To use RadHeatMap when working with NuGet packages, install the Telerik.Windows.Controls.DataVisualization.for.Wpf.Xaml package. The package name may vary slightly based on the Telerik dlls set - Xaml or NoXaml
Read more about NuGet installation in the Installing UI for WPF from NuGet Package article.
With the 2025 Q1 release, the Telerik UI for WPF has a new licensing mechanism. You can learn more about it here.
Adding Assembly References Manually
If you are not using NuGet packages, you can add a reference to the following assemblies:
- Telerik.Licensing.Runtime
- Telerik.Windows.Controls
- Telerik.Windows.Controls.DataVisualization
- Telerik.Windows.Data
You can find the required assemblies for each control from the suite in the Controls Dependencies help article.
Setting up the Data
To use the RadHeatMap control you will need to define a model that will describe the data that will be shown.
Example 1: Defining the model
public class TempInfo
{
    public int Year { get; set; }
    public string Month { get; set; }
    public double Temperature { get; set; }
}
Setting up the Control
The control works with few different definitions that describe how to data will be shown. In this example we will use the CategoricalDefinition. The definition provides few properties to define what data should be used.
The RowGroupMemberPath property contains the name of the property in the custom model that will be used to generate the rows.
The ColumnGroupMemberPath property contains the name of the property in the custom model that will be used to generate the columns.
The ValuePath property contains the name of the property in the custom model that will be used to generate the cells. Based on that value the cell will be colored differently.
To populate the control with data use its ItemsSource property.
Example 2: Defining the heatmap
<telerik:RadHeatMap>
    <telerik:RadHeatMap.Definition>
        <telerik:CategoricalDefinition x:Name="categoricalDefinition"
                                       RowGroupMemberPath="Year"
                                       ColumnGroupMemberPath="Month"
                                       ValuePath="Temperature" />
    </telerik:RadHeatMap.Definition>
</telerik:RadHeatMap>
Example 3: Creating the data and setting the ItemsSource
private void PrepareData()
{
    int year = 2018;
    string[] months = new string[6] { "Jan", "Feb", "Mar", "Apr", "May", "Jun" };
    var randomNumberGenerator = new Random();

    var source = new ObservableCollection<TempInfo>();
    for (int i = 0; i < months.Length; i++)
    {
        for (int k = 0; k < 6; k++)
        {
            var info = new TempInfo() { Year = year + k, Month = months[i], Temperature = randomNumberGenerator.Next(10, 300) };
            source.Add(info);
        }
    }

    this.categoricalDefinition.ItemsSource = source;
}
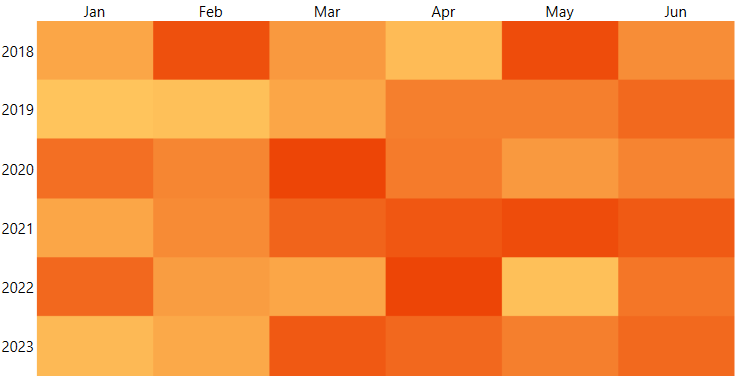
Figure 1: RadHeatMap
Colorization
The heatmap control has a built-in colorizer that sets the color of each cell based on the plotted value. You can change the colors as you like by defining a new colorizer. You can read more about this in the Colorizers article.
Telerik UI for WPF Learning Resources
- Telerik UI for WPF HeatMap Component
- Getting Started with Telerik UI for WPF Components
- Telerik UI for WPF Installation
- Telerik UI for WPF and WinForms Integration
- Telerik UI for WPF Visual Studio Templates
- Setting a Theme with Telerik UI for WPF
- Telerik UI for WPF Virtual Classroom (Training Courses for Registered Users)
- Telerik UI for WPF License Agreement