Populate RadChartView from Access Database
Environment
| Product Version | Product | Author |
|---|---|---|
| 2022.3.913 | RadChartView for WinForms | Dinko Krastev |
Description
RadChartView provides two ways of populating with data:
- Data Bound Mode: Data binding to a DataSource collection, e.g. a DataTable or a BindingList filled with data coming from your database:
- Unbound Mode: adding data points to each series. There are different series types, e.g. BarSeries, LineSeries, etc.
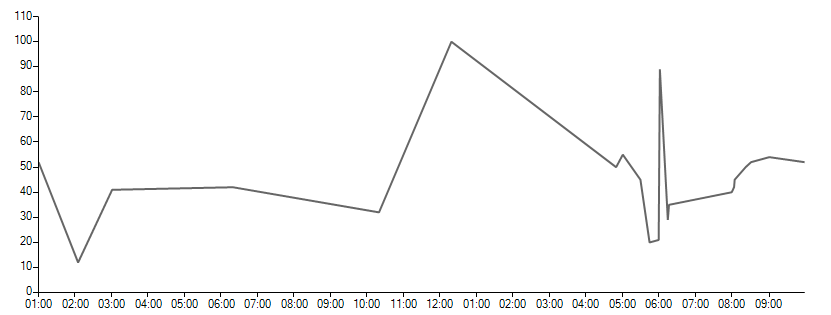
Using one of the two approaches you can populate the chart with the data extracted from the database. In this tutorial, we are going to get the data from the Access Database file and create DataTable to populate the RadChartView.
Solution
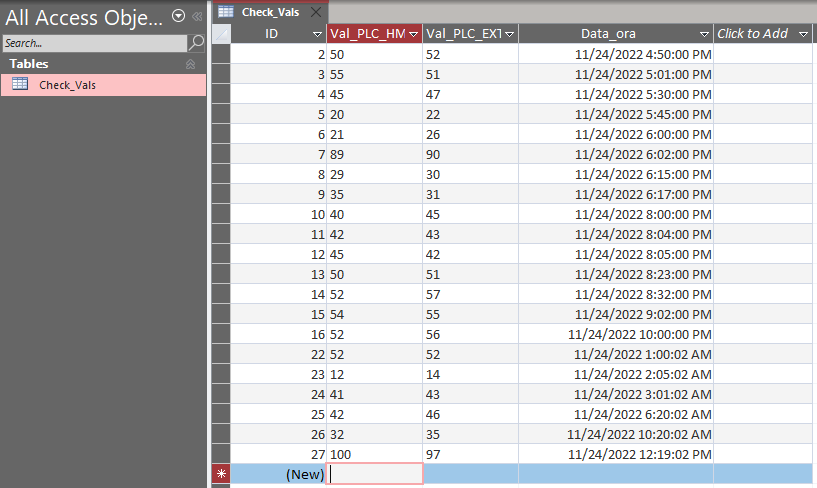
Here is a screenshot of how our Access Database could look like.

What we need to do is to extract the table values from the Access Database. Then we can create DataTable and use it as a DataSource for the RadChartView.

public partial class Form1 : Form
{
    DataTable table;
    public Form1()
    {
        InitializeComponent();
        table = new DataTable();
        table.Columns.Add("Val_PLC_HMI", typeof(double));
        table.Columns.Add("VAL_PLC_EXT", typeof(double));
        table.Columns.Add("Data_ora", typeof(DateTime));
        PopulateChart();
    }
    void PopulateChart()
    {
        OleDbConnection connection = new OleDbConnection(@"Provider=Microsoft.ACE.OLEDB.12.0;Data Source=../../Archivio.mdb");
        connection.Open();
        OleDbDataReader reader = null;

        // Check_Vals will be your table name
        OleDbCommand command = new OleDbCommand("SELECT * FROM Check_Vals", connection);
        reader = command.ExecuteReader();

        while (reader.Read())
        {
            var Val_PLC_HMI = double.Parse(reader[1].ToString());
            var VAL_PLC_EXT = double.Parse(reader[2].ToString());
            var Data_ora = DateTime.Parse(reader[3].ToString());
            table.Rows.Add(Val_PLC_HMI, VAL_PLC_EXT, Data_ora);
        }

        connection.Close();

        DateTimeContinuousAxis dateTimeContinuousAxis = new DateTimeContinuousAxis();
        dateTimeContinuousAxis.MajorStepUnit = TimeInterval.Hour;

        dateTimeContinuousAxis.MajorStep = 1;
        dateTimeContinuousAxis.LabelFormat = "{0:hh:mm}";
        LineSeries lineVal_PLC_HMI = new LineSeries();
        lineVal_PLC_HMI.HorizontalAxis = dateTimeContinuousAxis;
        radChartView1.Series.Add(lineVal_PLC_HMI);

        lineVal_PLC_HMI.ValueMember = "Val_PLC_HMI";
        lineVal_PLC_HMI.CategoryMember = "Data_ora";
        lineVal_PLC_HMI.DataSource = table;
    }
}
   Public Partial Class Form1
    Inherits Form

        Private table As DataTable

        Public Sub New()
            InitializeComponent()
            table = New DataTable()
            table.Columns.Add("Val_PLC_HMI", GetType(Double))
            table.Columns.Add("VAL_PLC_EXT", GetType(Double))
            table.Columns.Add("Data_ora", GetType(DateTime))
            PopulateChart()
        End Sub

        Private Sub PopulateChart()
            Dim connection As OleDbConnection = New OleDbConnection("Provider=Microsoft.ACE.OLEDB.12.0;Data Source=../../Archivio.mdb")
            connection.Open()
            Dim reader As OleDbDataReader = Nothing
            Dim command As OleDbCommand = New OleDbCommand("SELECT * FROM Check_Vals", connection)
            reader = command.ExecuteReader()

            While reader.Read()
                Dim Val_PLC_HMI = Double.Parse(reader(1).ToString())
                Dim VAL_PLC_EXT = Double.Parse(reader(2).ToString())
                Dim Data_ora = DateTime.Parse(reader(3).ToString())
                table.Rows.Add(Val_PLC_HMI, VAL_PLC_EXT, Data_ora)
            End While

            connection.Close()
            Dim dateTimeContinuousAxis As DateTimeContinuousAxis = New DateTimeContinuousAxis()
            dateTimeContinuousAxis.MajorStepUnit = TimeInterval.Hour
            dateTimeContinuousAxis.MajorStep = 1
            dateTimeContinuousAxis.LabelFormat = "{0:hh:mm}"
            Dim lineVal_PLC_HMI As LineSeries = New LineSeries()
            lineVal_PLC_HMI.HorizontalAxis = dateTimeContinuousAxis
            radChartView1.Series.Add(lineVal_PLC_HMI)
            lineVal_PLC_HMI.ValueMember = "Val_PLC_HMI"
            lineVal_PLC_HMI.CategoryMember = "Data_ora"
            lineVal_PLC_HMI.DataSource = table
        End Sub
    End Class