WinForms TreeMap Overview
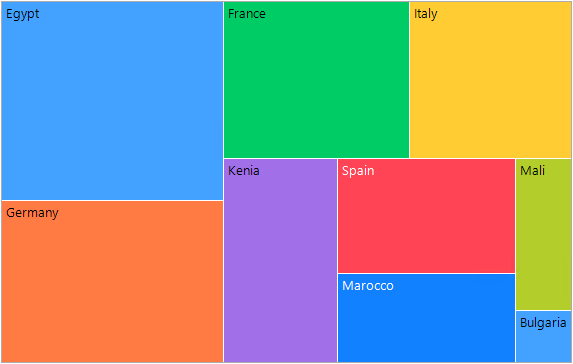
RadTreeMap is a data visualization control used to display hierarchical data as a set of nested rectangles. Each rectangle has an area proportional to a specified dimension on the data. It is useful in scenarios where a lot of items have to be compared in a limited space. When the color and size dimensions are correlated in some way with the tree structure, you can easily see patterns that would be difficult to spot in other ways.
The TreeMap is part of Telerik UI for WinForms, a
professional grade UI library with 160+ components for building modern and feature-rich applications. To try it out sign up for a free 30-day trial.
![]()
Key Features:
Different tiling algorithms: The control support two tiling algorithms to visualize the data - Squarified and Slice and Dice. The default one is Squarified.
Colorizers: The colorizers allow you to choose different colors for the different tiles in the control.
Selection: The control supports selection functionality that allows you to highlight items upon click or setting a property.
Data binding support: The RadTreeMap control can be bound to a hierarchical collection which will be visualized in a tree-like layout.
Automatic items ordering: The layout orientation (vertical or horizontal) will be chosen automatically - by calculating the available space for the given data. When horizontal orientation is applied - the child tiles are going to be stacked horizontally. Respectively vertical orientation will make the child tiles to be stacked vertically.
Telerik UI for WinForms Learning Resources
- Telerik UI for WinForms Homepage
- Get Started with the Telerik UI for WinForms
- Telerik UI for WinForms API Reference
- Getting Started with Telerik UI for WinForms Components
- Telerik UI for WinForms Virtual Classroom (Training Courses for Registered Users)
- Telerik UI for WinForms Forum
- Telerik UI for WinForms Knowledge Base
Telerik UI for WinForms Additional Resources
- Telerik UI for WinForms Product Overview
- Telerik UI for WinForms Blog
- Telerik UI for WinForms Videos
- Telerik UI for WinForms Roadmap
- Telerik UI for WinForms Pricing
- Telerik UI for WinForms Code Library
- Telerik UI for WinForms Support
- What’s New in Telerik UI for WinForms