Getting Started with WinForms HeatMap
This article shows how you can start using RadHeatMap.
Adding Telerik Assemblies Using NuGet
To use RadHeatMap when working with NuGet packages, install the Telerik.UI.for.WinForms.AllControls package. The package target framework version may vary.
Read more about NuGet installation in the Install using NuGet Packages article.
With the 2025 Q1 release, the Telerik UI for WinForms has a new licensing mechanism. You can learn more about it here.
Adding Assembly References Manually
When dragging and dropping a control from the Visual Studio (VS) Toolbox onto the Form Designer, VS automatically adds the necessary assemblies. However, if you're adding the control programmatically, you'll need to manually reference the following assemblies:
- Telerik.Licensing.Runtime
- Telerik.WinControls
- Telerik.WinControls.UI
- TelerikCommon
The Telerik UI for WinForms assemblies can be install by using one of the available installation approaches.
Defining the RadHeatMap
This article shows how you can start using RadHeatMap. Just drag a RadHeatMap from the toolbox and drop it onto the form. Then, you can define sample data and bind the control:
Setting up the Data
To use the RadHeatMap control you will need to define a model that will describe the data that will be shown.
public class TempInfo
{
    public int Year { get; set; }
    public string Month { get; set; }
    public double Temperature { get; set; }
}
Public Class TempInfo
    Public Property Year As Integer
    Public Property Month As String
    Public Property Temperature As Double
End Class
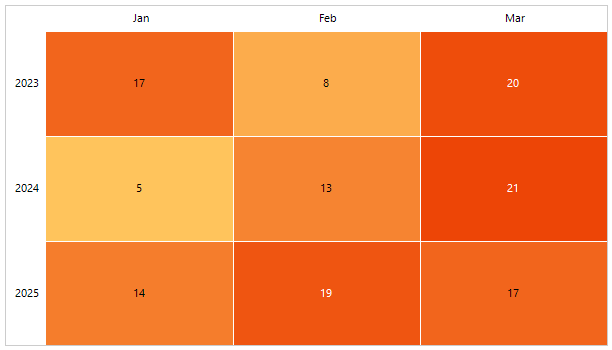
Setting up the Control
The control works with a few different definitions that describe how to data will be shown. In this example, we will use the CategoricalDefinition. The definition provides few properties to define what data should be used.
- RowGroupMember: Contains the name of the property in the custom model that will be used to generate the rows.
- ColumnGroupMember: Contains the name of the property in the custom model that will be used to generate the columns.
- ValueMember: Contains the name of the property in the custom model that will be used to generate the cells. Based on that value the cell will be colored differently.
What's left is to create our sample data and set the DataSource property of the CategoricalDefinition. Then this definition needs to be applied to the RadHeatMap.Definition property.
private void PrepareData()
{
    int year = 2018;
    string[] months = new string[6] { "Jan", "Feb", "Mar", "Apr", "May", "Jun" };
    var randomNumberGenerator = new Random();

    var source = new BindingList<TempInfo>();
    for (int i = 0; i < months.Length; i++)
    {
        for (int k = 0; k < 6; k++)
        {
            var info = new TempInfo() { Year = year + k, Month = months[i], Temperature = randomNumberGenerator.Next(10, 300) };
            source.Add(info);
        }
    }
    CategoricalDefinition categoricalDefinition = new CategoricalDefinition();
    categoricalDefinition.RowGroupMember = "Year";
    categoricalDefinition.ColumnGroupMember = "Month";
    categoricalDefinition.ValueMember = "Temperature";
    categoricalDefinition.DataSource= source;
    this.radHeatMap1.DisplayCellText = true;
    this.radHeatMap1.Definition = categoricalDefinition;
}
Private Sub PrepareData()
    Dim year As Integer = 2018
    Dim months As String() = New String(5) {"Jan", "Feb", "Mar", "Apr", "May", "Jun"}
    Dim randomNumberGenerator = New Random()
    Dim source = New BindingList(Of TempInfo)()

    For i As Integer = 0 To months.Length - 1

        For k As Integer = 0 To 6 - 1
            Dim info = New TempInfo() With {
                .Year = year + k,
                .Month = months(i),
                .Temperature = randomNumberGenerator.[Next](10, 300)
            }
            source.Add(info)
        Next
    Next

    Dim categoricalDefinition As CategoricalDefinition = New CategoricalDefinition()
    categoricalDefinition.RowGroupMember = "Year"
    categoricalDefinition.ColumnGroupMember = "Month"
    categoricalDefinition.ValueMember = "Temperature"
    categoricalDefinition.DataSource = source
    Me.RadHeatMap1.DisplayCellText = True
    Me.RadHeatMap1.Definition = categoricalDefinition
End Sub
See Also
Telerik UI for WinForms Learning Resources
- Telerik UI for WinForms Heatmap Component
- Getting Started with Telerik UI for WinForms Components
- Telerik UI for WinForms Setup
- Telerik UI for WinForms Application Modernization
- Telerik UI for WinForms Visual Studio Templates
- Deploy Telerik UI for WinForms Applications
- Telerik UI for WinForms Virtual Classroom(Training Courses for Registered Users)
- Telerik UI for WinForms License Agreement)